


The Advanced Tick Analyzer (ATA) is one of the flagship tools in the OrderFlow X – Algorithmic Master Pack. It offers a unique perspective on market activity by combining real-time tape reading with volume heat zones, helping traders identify where institutional interest and strong hands are appearing — as it happens.
🎯 What Is ATA?
ATA is a multi-layered indicator that scans every tick and volume event on the chart to pinpoint moments of peak interest and price sensitivity. It’s designed to highlight inflection points, volume surges, and psychological turning zones, giving the trader both a real-time alert system and historical context.
📌 Key Features
🟡 Yellow Level – Point of Maximum Interest
This level highlights the most actively contested price point so far in the session — where buyers and sellers are most engaged. It was originally discovered during development of the CPOC system.
🔴 Red Level – Strong Hand Detected
The red line indicates a significant direct entry (limit or market order) from a strong hand. These large transactions often cause immediate price movement and signal institutional positioning.
⚪ White Level – Psychological Inflection Zone
Often seen during U.S. session opens, this level captures areas where high volume is detected without necessarily being the highest, but followed by directional shifts — classic traps or exhaustion points.
📊 Real-Time Insights, Backed by AI
Each signal comes with:
Contract size (text) on screen
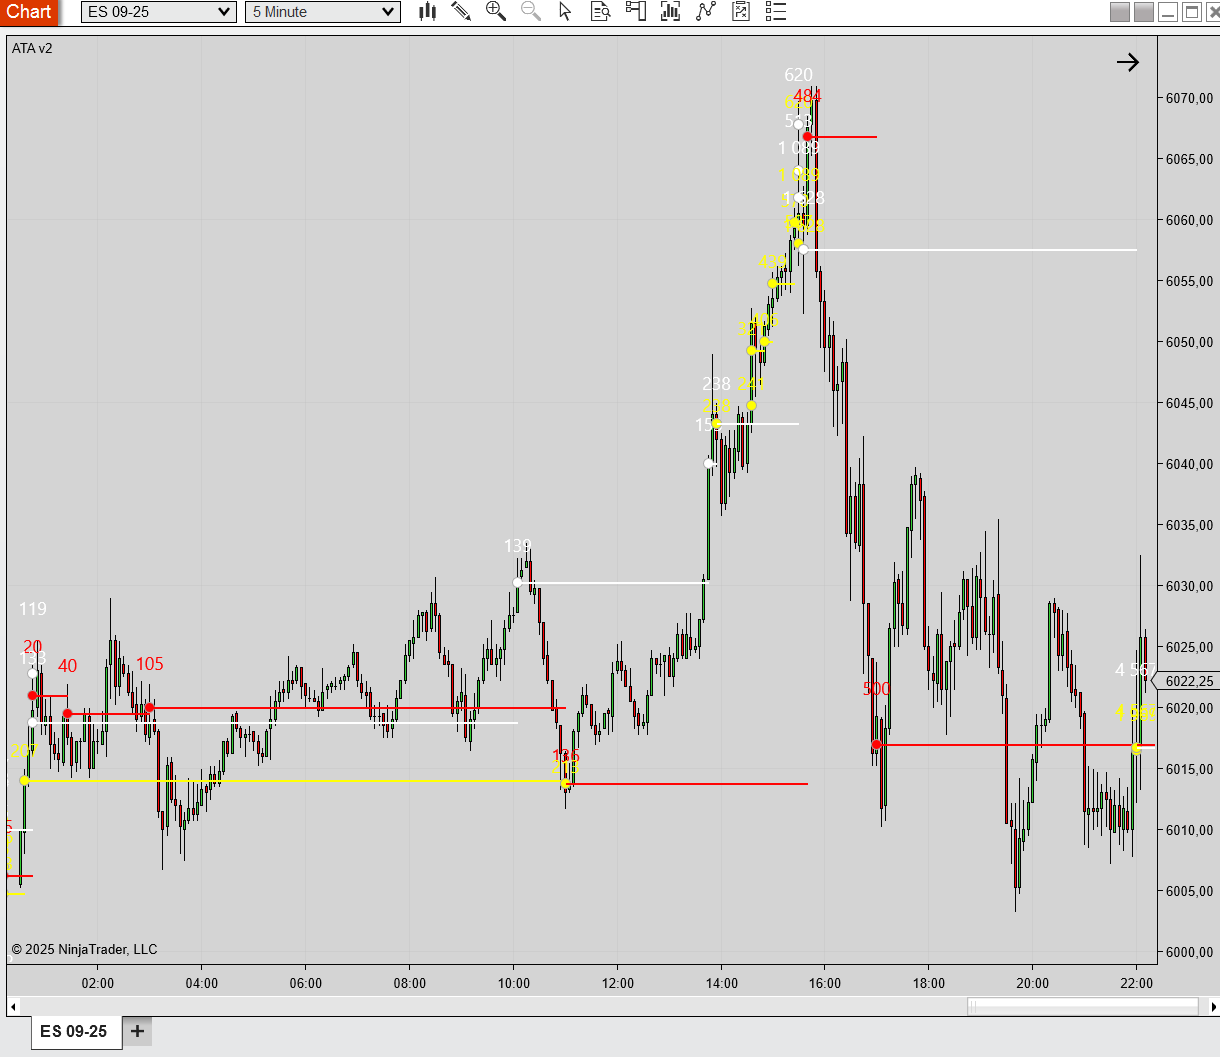
Percentile score (based on the past 365 days) to assess how significant that event is compared to historical context
Optional AI-based analysis (can be toggled off to save resources)
ATA gives context, not just data — helping you answer “how big is this move, really?” in the moment it matters.
🛠️ Customization & Alerts
ATA is fully configurable:
Filter levels by percentile importance
Enable/disable individual signal types (yellow, red, white)
Instant Telegram alerts for each level (independently toggled)
Works seamlessly with Renko, Range, and M5 timeframes
Built for speed — alerts may arrive even milliseconds before the chart renders the activity
⚡ This minimal lag is intentional — to give manual traders the fastest possible edge.
📈 Example Use Case in Renko
ATA shines especially in non-time-based charts like Renko. It shows:
Silent absorption areas
Trap zones where smart money enters

Momentum breakouts or reversion points
You’ll start to see the market as a story, not just candles.
🔗 Try It with the Full Pack
The ATA is included in the OrderFlow X – Algorithmic Master Pack,
No comment yet, add your voice below!