

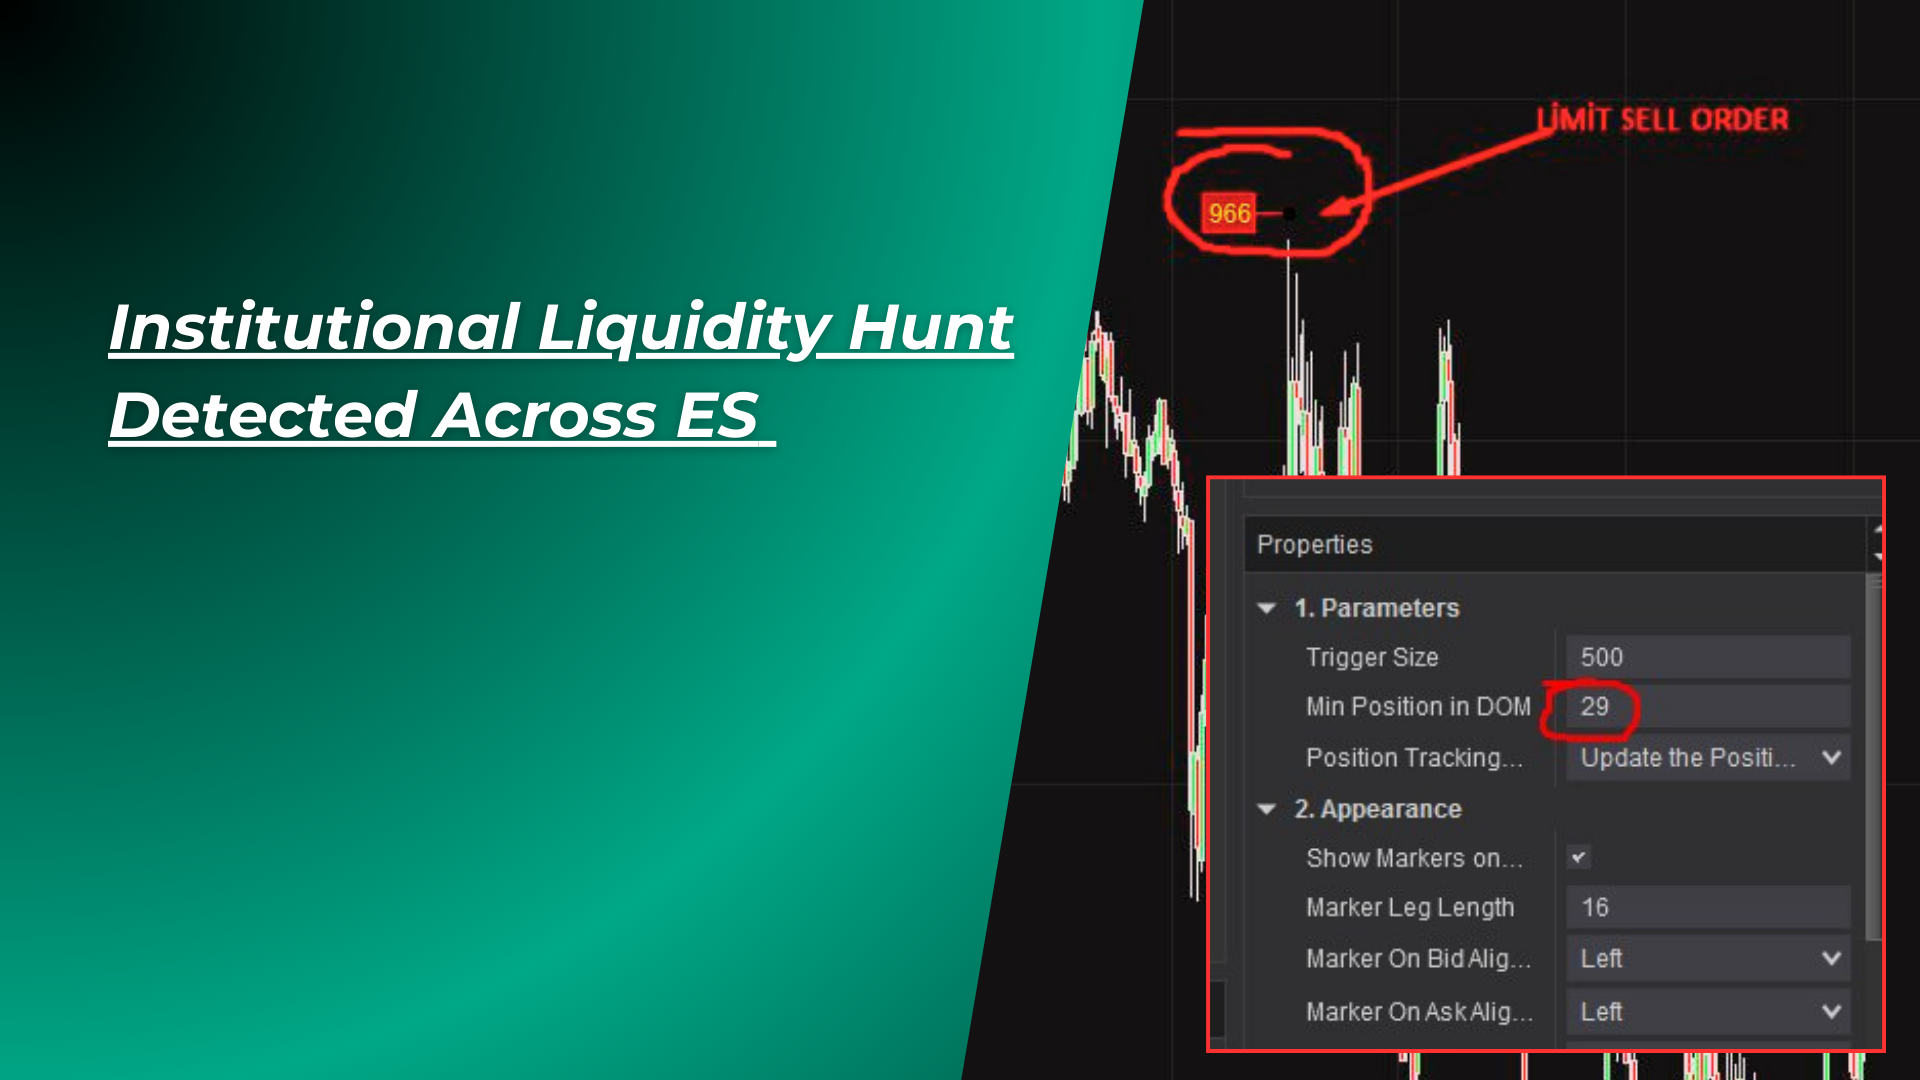
Institutional Liquidity Hunt Detected Across ES and Nasdaq
Massive coordinated sell orders appeared simultaneously on ES (S&P 500 Futures) and Nasdaq, signaling potential market exhaustion. Such moves often indicate institutional liquidity hunts or hedging ahead of macro events — a psychological warning to traders that heavy supply sits above.

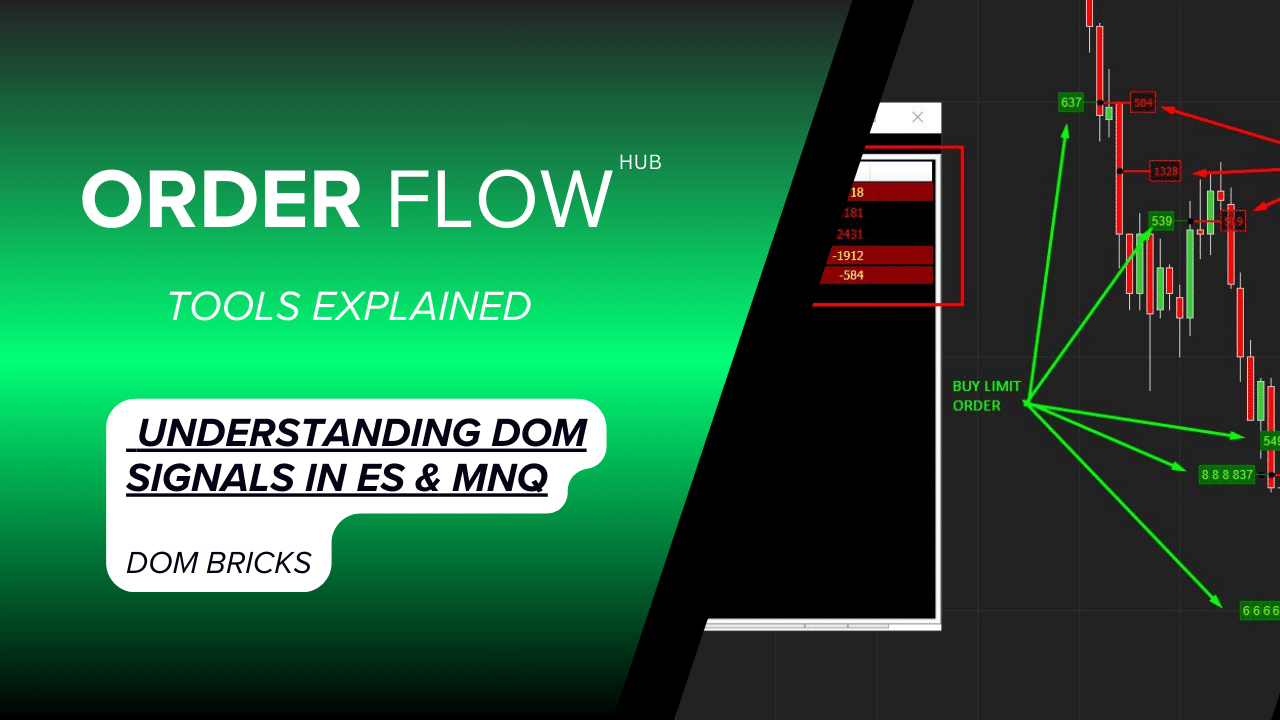
DOM Bricks – Smart Money Footprints: Understanding DOM Signals in ES & MNQ
Recent order flow activity highlights where institutional players are drawing the line. In the Micro E-mini S&P 500 (MES), multiple 500+ lot aggressive sell orders signaled short-term exhaustion, while in ES futures, the 6383 level acted as a strong buy wall. Meanwhile, MNQ showed early signs of heavy sell-side pressure, often serving as a leading indicator for Nasdaq’s broader moves.

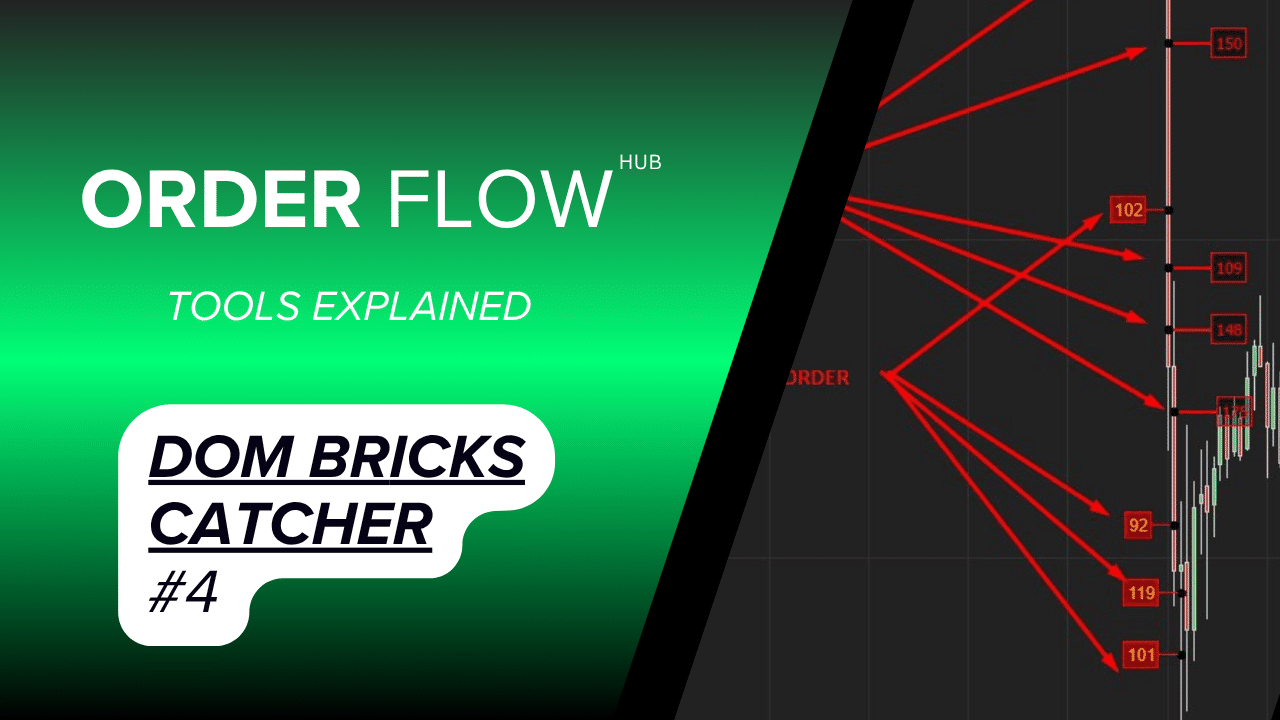
DOM Bricks Catcher #4
In GC Futures, an aggressive 135-lot market sell at 138 broke through resting limit buy orders, signaling strong selling pressure and confirming sellers’ control. Subsequent large sell orders and stacked limit sell walls reinforced the bearish momentum, creating strong resistance above. Meanwhile, the Nasdaq saw a 1,044-lot aggressive limit buy at 23,345, indicating heavy short-term buying interest amid breakout patterns in major tech stocks and record-high attempts. Overall, the contrasting order flow suggests short opportunities in gold, while Nasdaq strength remains supported by bullish sentiment and key moving average support.

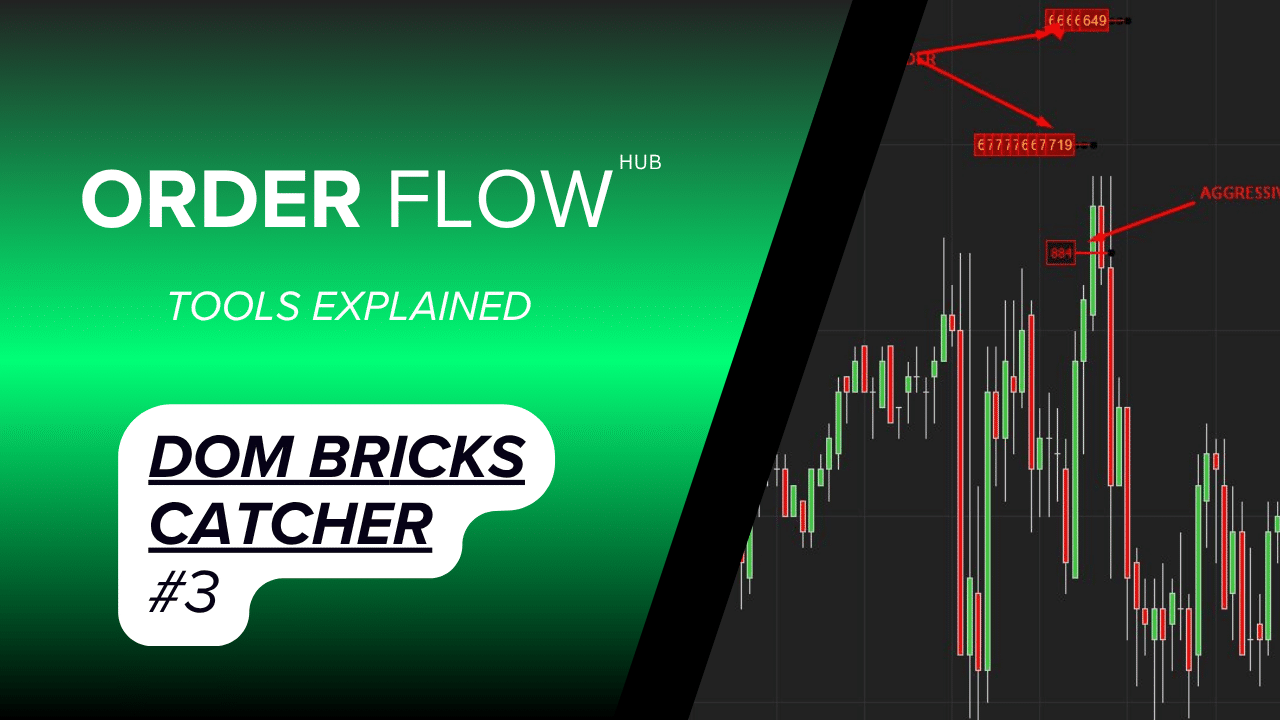
DOM Bricks Catcher #3
Order Flow Strategy – Futures Market Insights
Analyze institutional activity in MES, ES, GC, and 6E futures using tape reading and DOM data. Spot aggressive selling, absorption failures, and key price imbalances during events like the FED press conference. Perfect for traders seeking edge through real-time order flow signals.


DOM Bricks Catcher #2
This article explores how the DOM Bricks indicator on NinjaTrader effectively identifies large institutional iceberg orders through repetitive lot clustering. By analyzing these stacked 600-lot blocks, traders can detect smart money absorption and anticipate bullish momentum shifts. The discussion also contextualizes recent market moves within macroeconomic events, emphasizing the indicator’s role in enhancing trade decision-making under dynamic conditions.


DOM Bricks Catcher
Identify institutional buy/sell pressure in real time with DOM Bricks. Track large-lot orders (400+ contracts) in ES, Gold, and Nasdaq futures. React faster to market-moving prints and uncover true support/resistance zones hidden in the order book. Ideal for serious order flow traders.

ES – DOM Analysis & Powell Integration
A massive 1101-lot buy wall at 6604 triggered a sharp rally, followed by distribution at 6711. Smart money accumulated low, sold high — classic institutional order flow.

Algorithmic Panic: 1500+ Lot Sell Wave Hits Futures After Trump’s Tariff Threat
Real-time order flow and DOM data reveal a coordinated algo-driven liquidation — the ultimate Smart Money move.

Sweep Dynamics and Reversal Patterns – July 19, 2024
Trading Analysis for July 19: Introduction On July 19, 2024, as we approached 1:00 PM, a notable trading pattern emerged, illustrating the dynamics of aggressive buying and selling. In this analysis, we will examine

Analyzing the S&P 500 Market Close on July 15, 2024
Introduction As we approach the market close on July 15, 2024, at 15:52, we enter what I call the “golden zone” or “sunset” period for the S&P 500. This is a critical time for

Economic News and Market Analysis for July 11, 2024
Order Flow Analysis of S&P 500 for July 11, 2024 Introduction On July 11, 2024, several significant economic indicators were released, impacting the financial markets. This analysis will focus on the Core CPI and

Market Dynamics: Absorption and Trend Reversal on July 3, 2024
Order Flow Analysis of S&P 500 for July 3, 2024 Introduction In this analysis, we will examine the S&P 500’s price movements on July 3, 2024, utilizing order flow and market dynamics insights. We