

The Dynamic Support Resistance indicator is designed for traders who need their levels to move with the market, not lag behind it. Originally developed for algorithmic trading, this tool dynamically updates based on a custom formula that blends price and volume behavior.
Unlike traditional support and resistance lines drawn from past data, this indicator reacts to what’s happening right now — highlighting zones that either support buying, support selling, or suggest a ranging market.
🎯 What Does It Do?
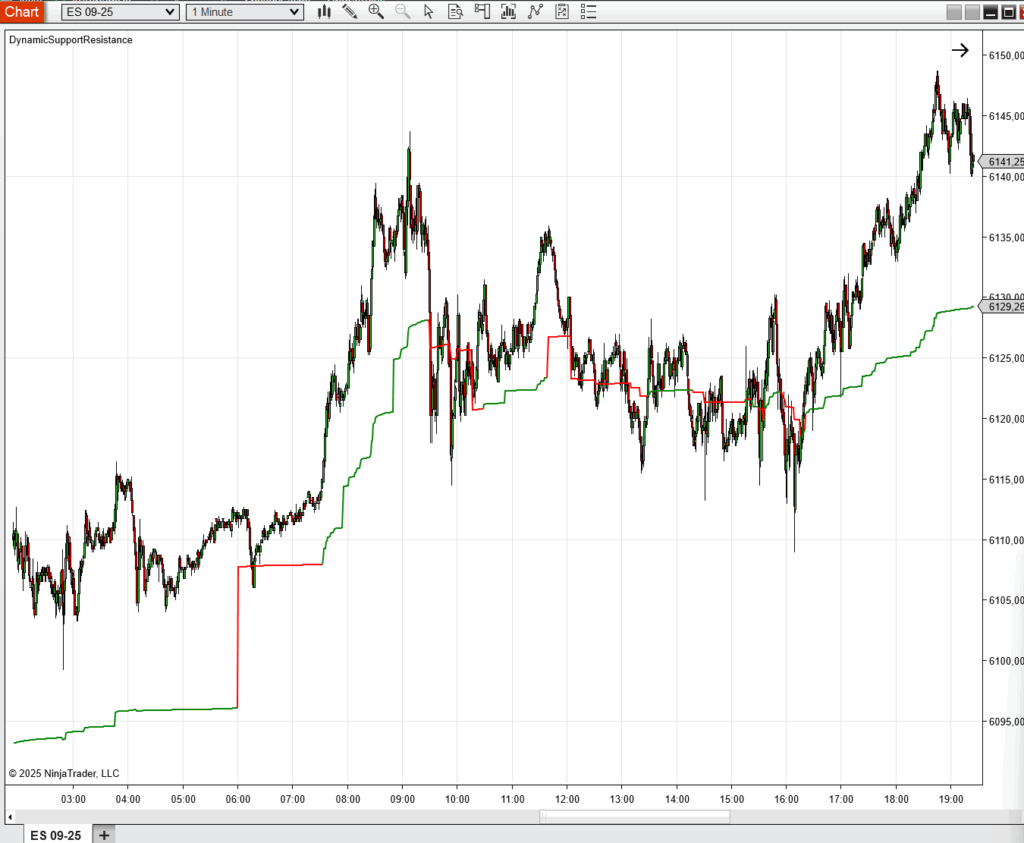
This indicator creates a dynamic band that tracks price in real time.
Its color tells you the current market condition:
- 🟩 Green: Buying pressure is supported.
- 🔵 Blue: The market is likely in a neutral/range state.
- 🟥 Red: Selling pressure is supported.
This color doesn’t signal immediate entries — instead, it acts as a filter or context layer. When price reaches this zone and the color confirms a bias, you wait for your entry trigger (from your own system or another indicator).
📌 How to Use It
- Use it as a trend-following support/resistance filter.
- Combine with order flow or price action tools to refine entries.
- Integrate into algorithmic or semi-automated strategies.
- Avoid false signals during range periods by watching for blue zones.
🧠 Why It Works
Unlike static levels that may become irrelevant as volatility increases or market conditions change, Dynamic Support Resistance evolves with the flow — helping you stay aligned with the true current bias of the market.
Whether you’re building bots or trading manually, this indicator provides a clean visual framework for context-sensitive decisions.
⚙️ Key Features
- Works in real time on any timeframe
- Based on a proprietary formula of price + volume
- Color-coded zones make market bias easy to interpret
- Lightweight and customizable
Full details and examples here:OrderFlow X – Algorithmic Master Pack
No comment yet, add your voice below!