

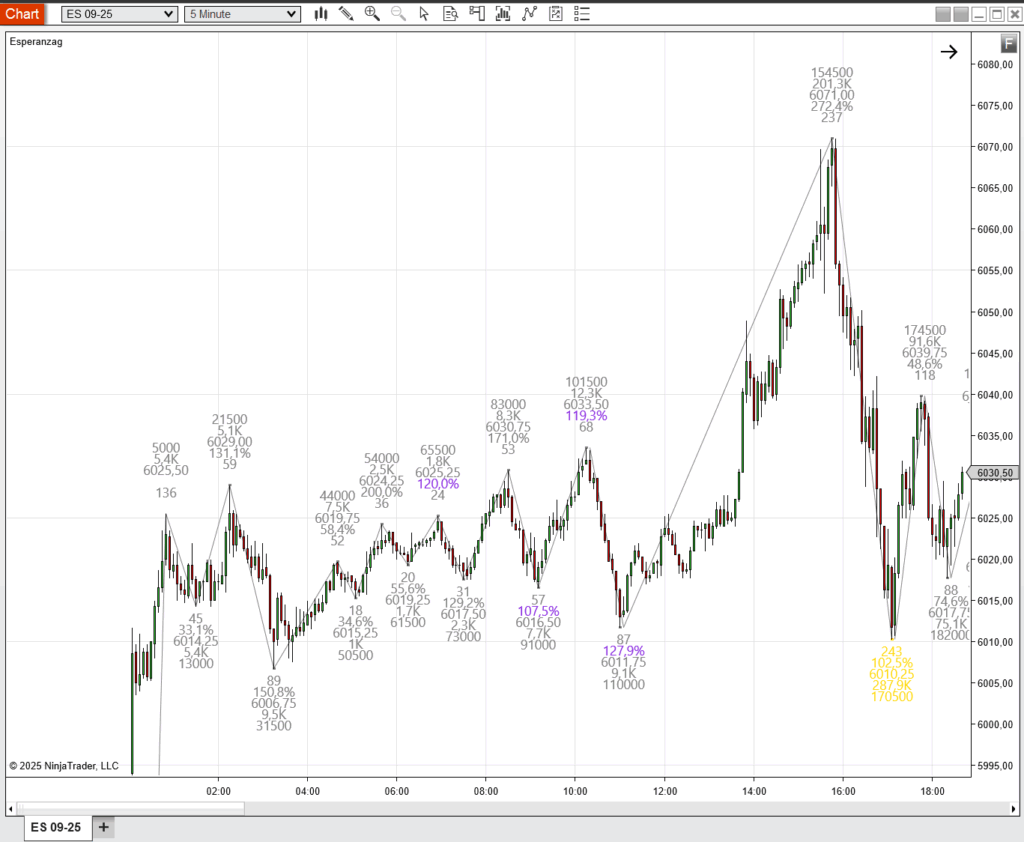
Esperanzag (pronounced: “Esperanza-graph”) is an advanced price leg dissection indicator that helps traders understand the true internal structure of market moves.
It automatically breaks down each swing to reveal:
- How much volume was involved
- The percentage of price change and retracement
- How long each movement took in candles, minutes, or hours
- And whether the structure is symmetrical or part of a potential fakeout zone
🎯 What Does It Do?
Esperanzag breaks down every directional movement on your chart and reveals key statistical data, including:
- 📊 Volume accumulated in each leg
- 🔁 Percentage change and continuation/retracement ticks
- ⏱️ Duration of the move (candles, minutes, or hours)
- 🟨 Symmetrical zones (highlighted in yellow)
- 🟪 Fakeout zones (highlighted in purple)
It doesn’t just show zigzag lines — it quantifies the move behind them.
🧠 What Makes It Unique?
The indicator highlights sections — sequences of price action — where market behavior either follows a pattern or deviates significantly:
- Symmetrical patterns (near 100% mirrored legs) help identify potential double tops/bottoms and reversal setups
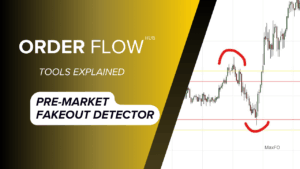
- Fakeout zones mark areas where a movement looks valid but lacks structural confirmation — great for trap detection
You can activate/deactivate display elements like:
- Movement start/end points
- % of movement
- Duration in candles
Full details and examples here:OrderFlow X – Algorithmic Master Pack
No comment yet, add your voice below!