

Order Flow Insights: Institutional Walls in MES, ES and MNQ Futures
Micro E-mini S&P 500 futures
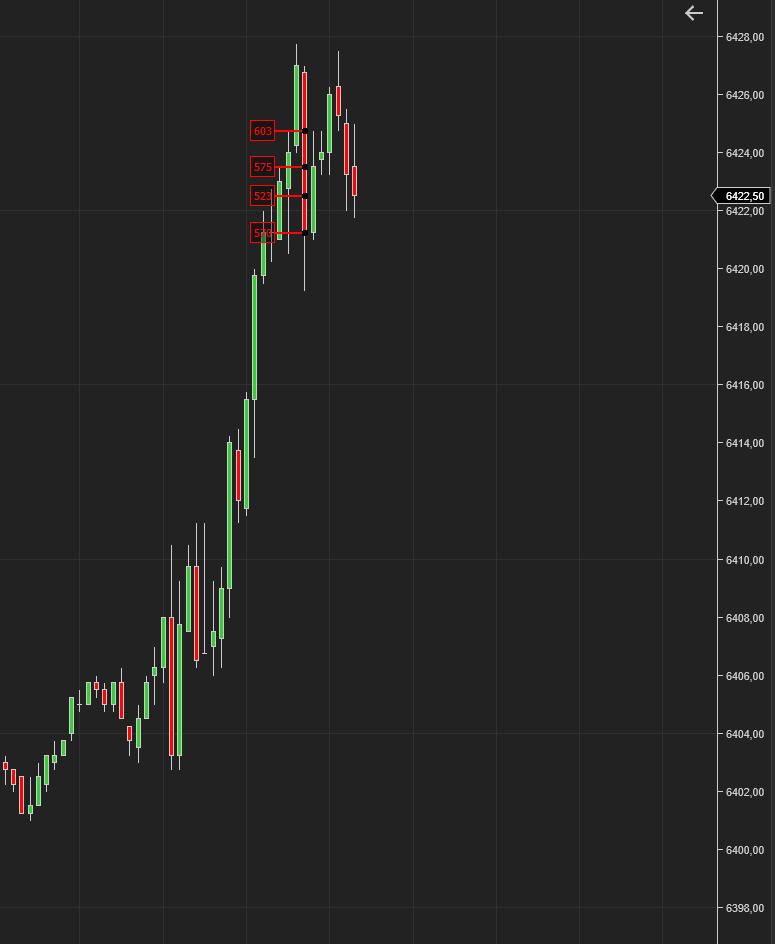
This chart shows that in the MES, there was a sudden aggressive wave of selling activity, with multiple orders above 500 lots executed in quick succession.
Such large sell imbalances typically indicate either:
Institutional profit-taking after the strong upward move.
Short-term resistance being defended heavily by large players.
A possible shift in momentum, as aggressive sellers step in to absorb the liquidity at higher levels.
In short:![]() The aggressive sell orders (500+ lots) suggest strong resistance and potential exhaustion of the recent rally, signaling that larger players may be trying to push price lower or at least cap further upside in the short term.
The aggressive sell orders (500+ lots) suggest strong resistance and potential exhaustion of the recent rally, signaling that larger players may be trying to push price lower or at least cap further upside in the short term.
ES FUTURES
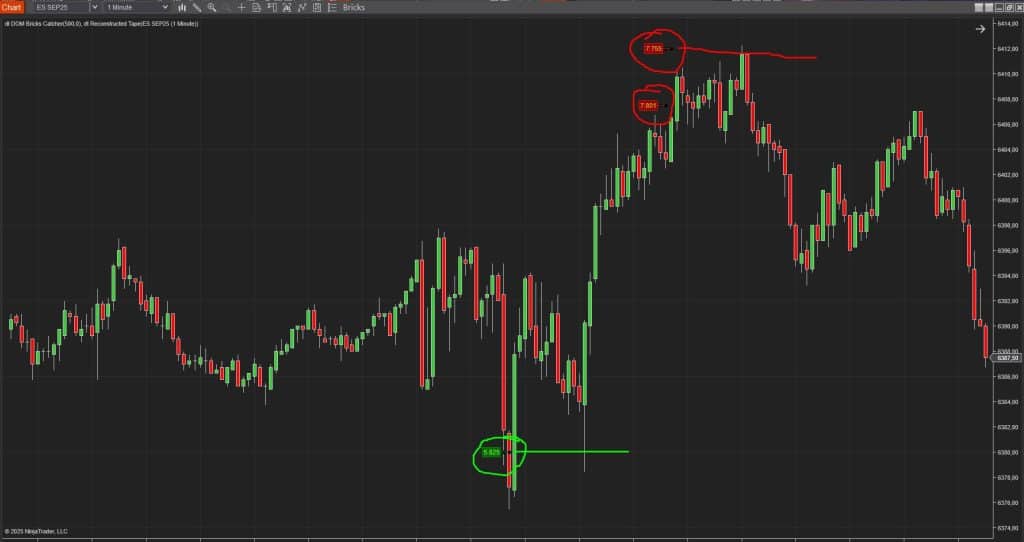
At 6383.00, we saw a strong 825-lot buy limit order, which acted like an institutional defense level. This absorption created the base for the sharp upward move.
Later, as price reached the 6408–6412 zone, we encountered two consecutive large sell limit walls:
- 801 lots
- 755 lots
These massive offers signal institutional profit-taking or an intentional cap to prevent further upside momentum. The fact that price stalled exactly at this region shows strong resistance created by smart money.
Interpretation:
- 6383 = Institutional support (buyers defending).
- 6410 zone = Institutional resistance (sellers defending).
The market is boxed between these two heavy levels, and whichever side gets broken next will likely dictate the next big move.
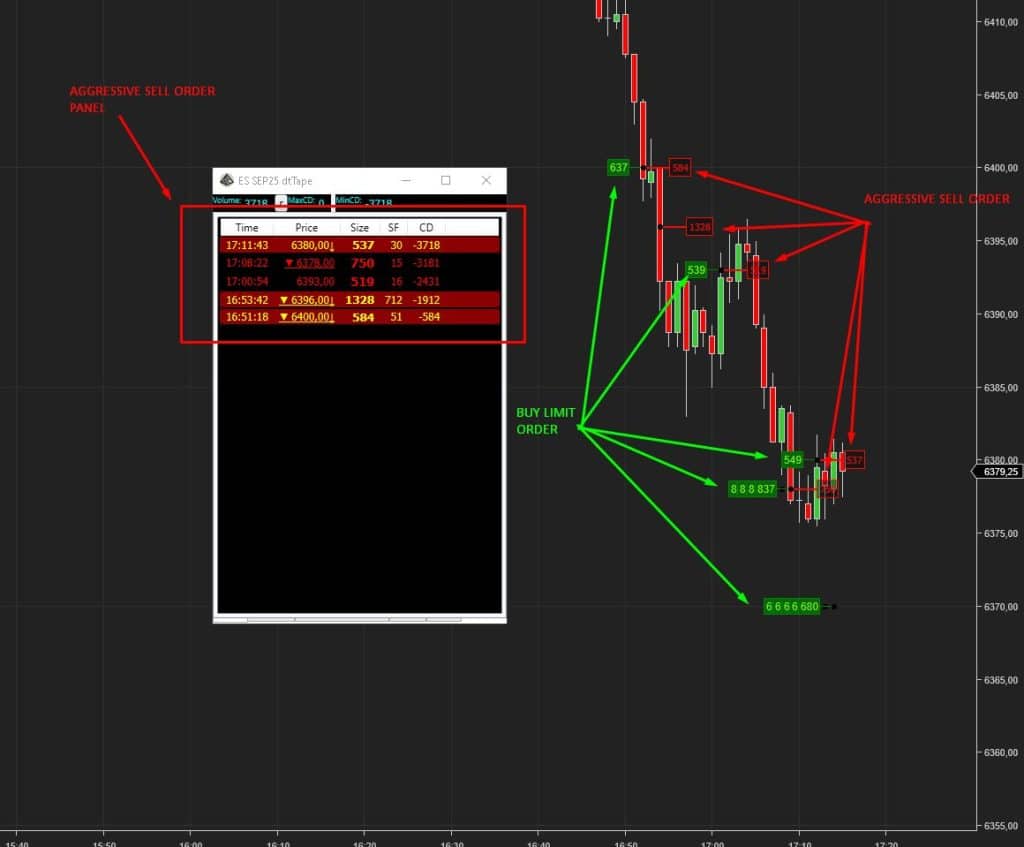
What we’re looking at here is a battle between passive buyers and aggressive sellers in the Order Flow (DOM).
- Limit Buy Orders (Passive Players) → Marked in green boxes. These are buyers waiting with limit orders at specific price levels.
- For example, 837, 539, 680 contracts are stacking up as buy walls.
- Aggressive Sell Orders (Active Players) → Marked in red boxes. These are sellers hitting the bid with market sell orders.
- For example, 1328, 584, 537 contracts are smashing into those buy walls.
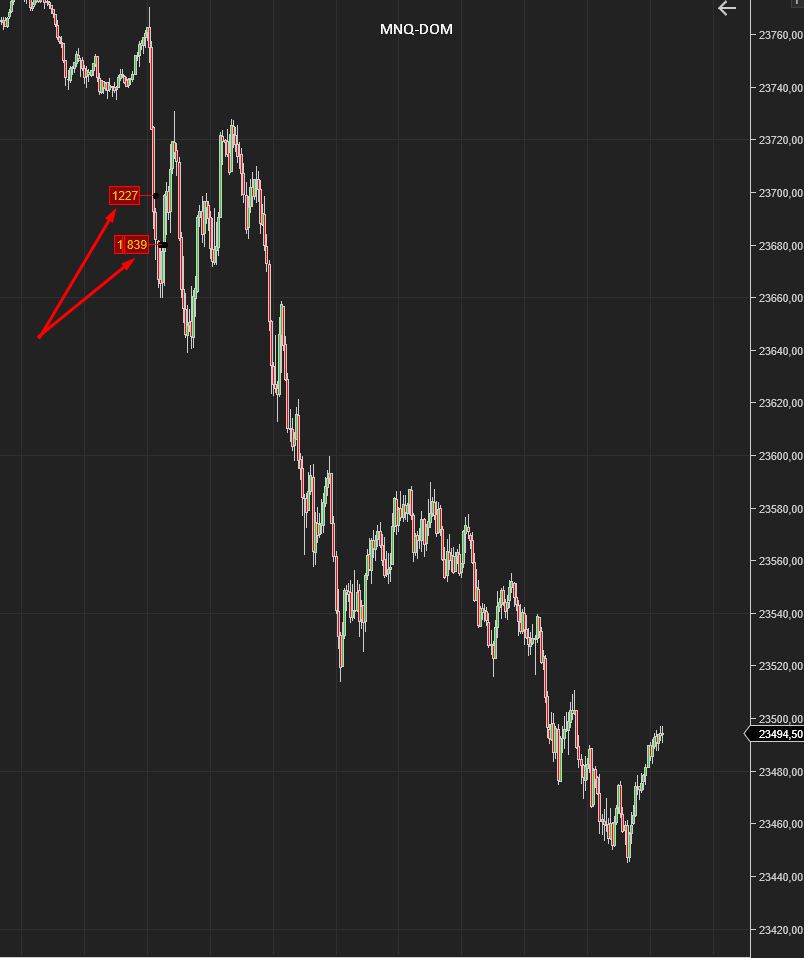
MNQ
In today’s DOM action, MNQ took the lead:
- 1,277-lot sell limit at 23,699
- 831-lot sell limit at 23,681
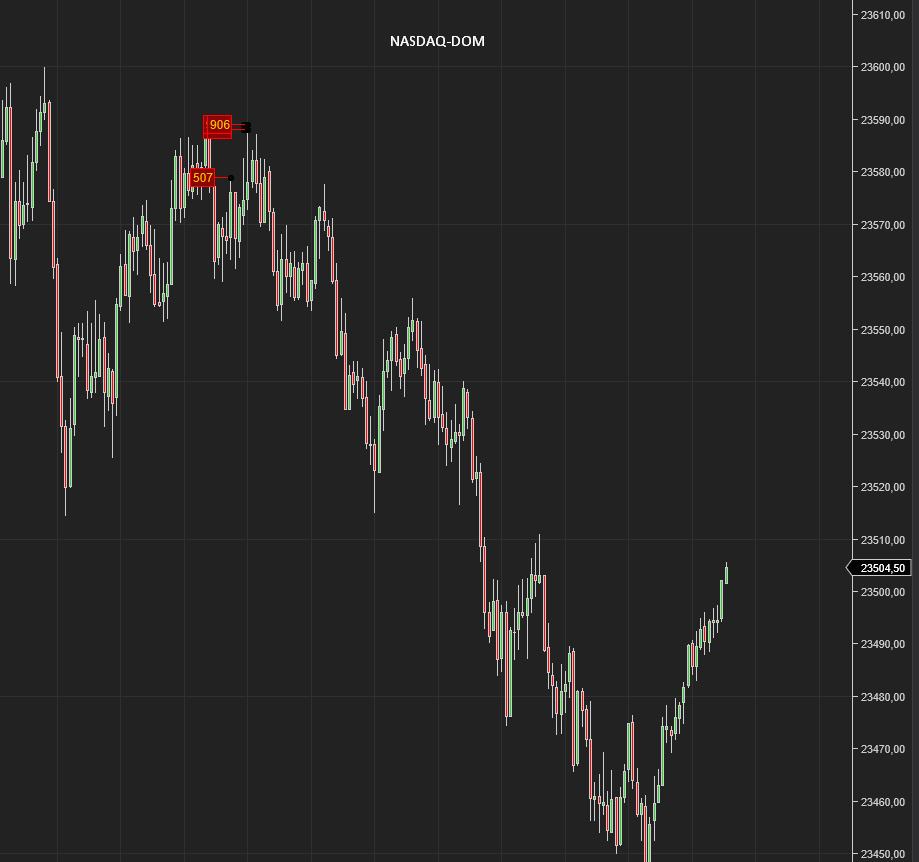
Meanwhile, on NASDAQ:
- 906 lots and 507 lots sell orders stacked.
Recent observations show that MNQ often flashes these heavy sell limits first, making it a leading indicator. When 1,000+ lot sell walls appear on MNQ, Nasdaq tends to follow with broader sell-side pressure. That gives traders an early edge in anticipating directional flow.
IBD Context:
According to the latest Investor’s Business Daily coverage, Nasdaq’s Adenza acquisition is paying off—cost savings are ahead of schedule, cross-sales are working, and subscription revenue is building sticky growth. Nasdaq stock has doubled since the deal, putting it in the same league as Moody’s or MSCI.
![]() That means:
That means:
- Short-term DOM signals = bearish tilt.
- Long-term corporate story = bullish transformation.


No comment yet, add your voice below!