
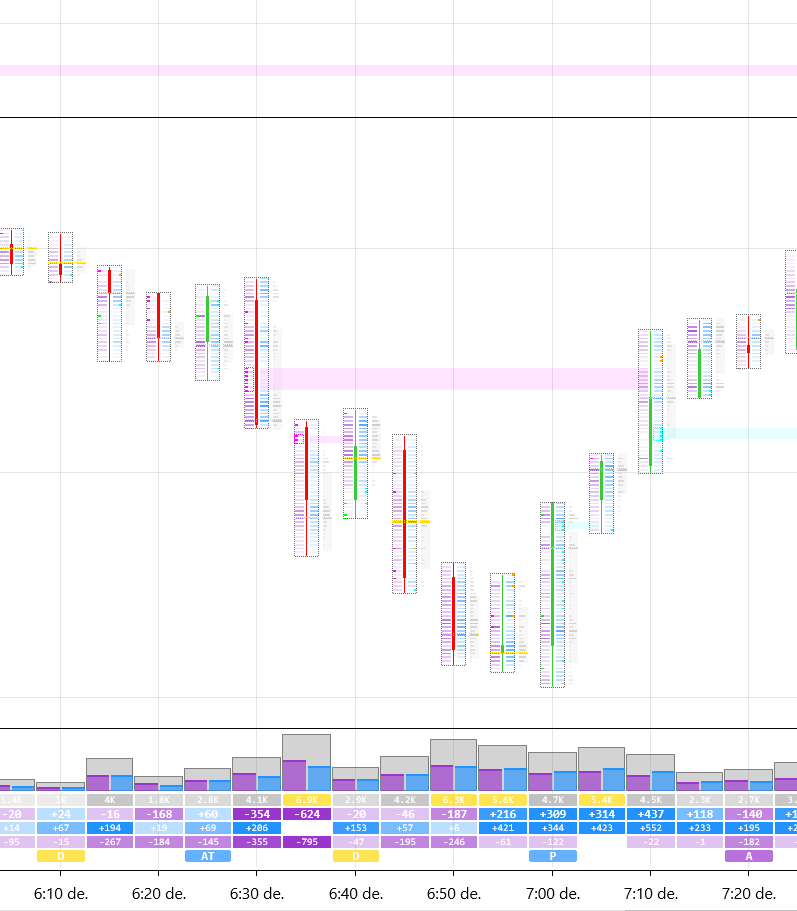
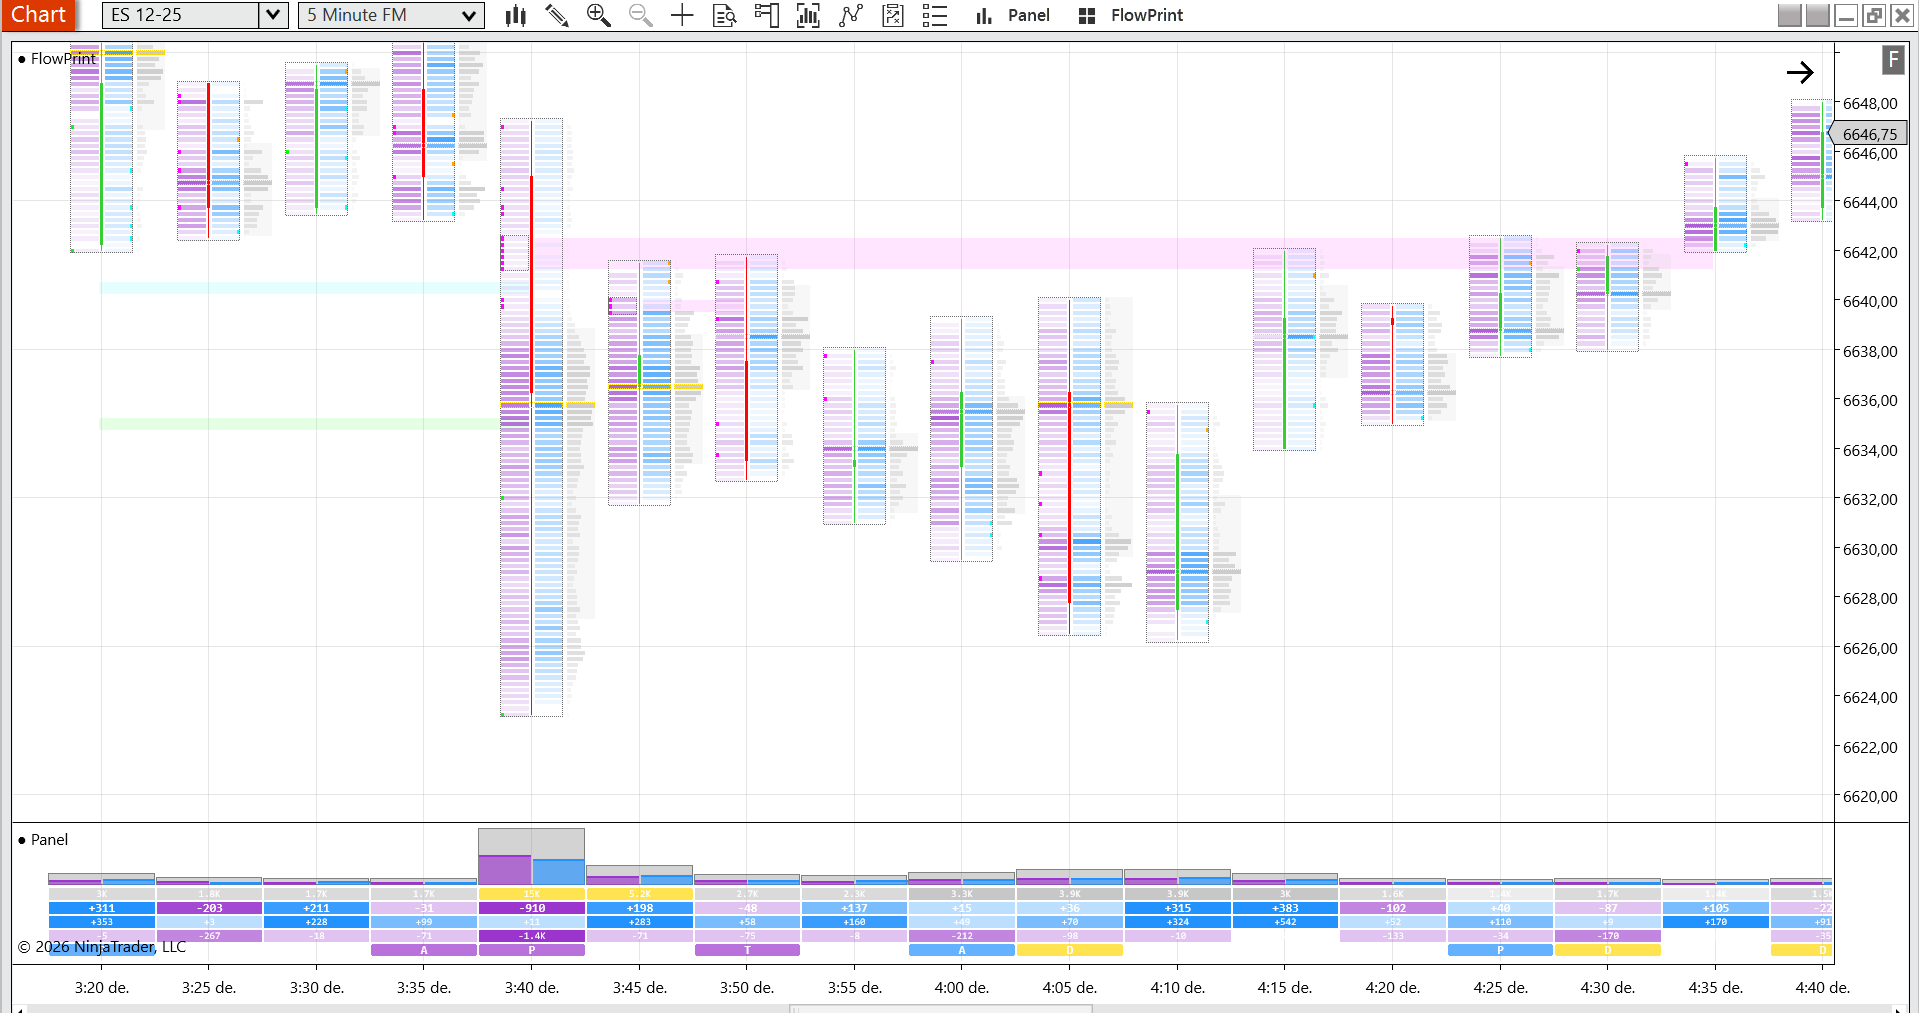
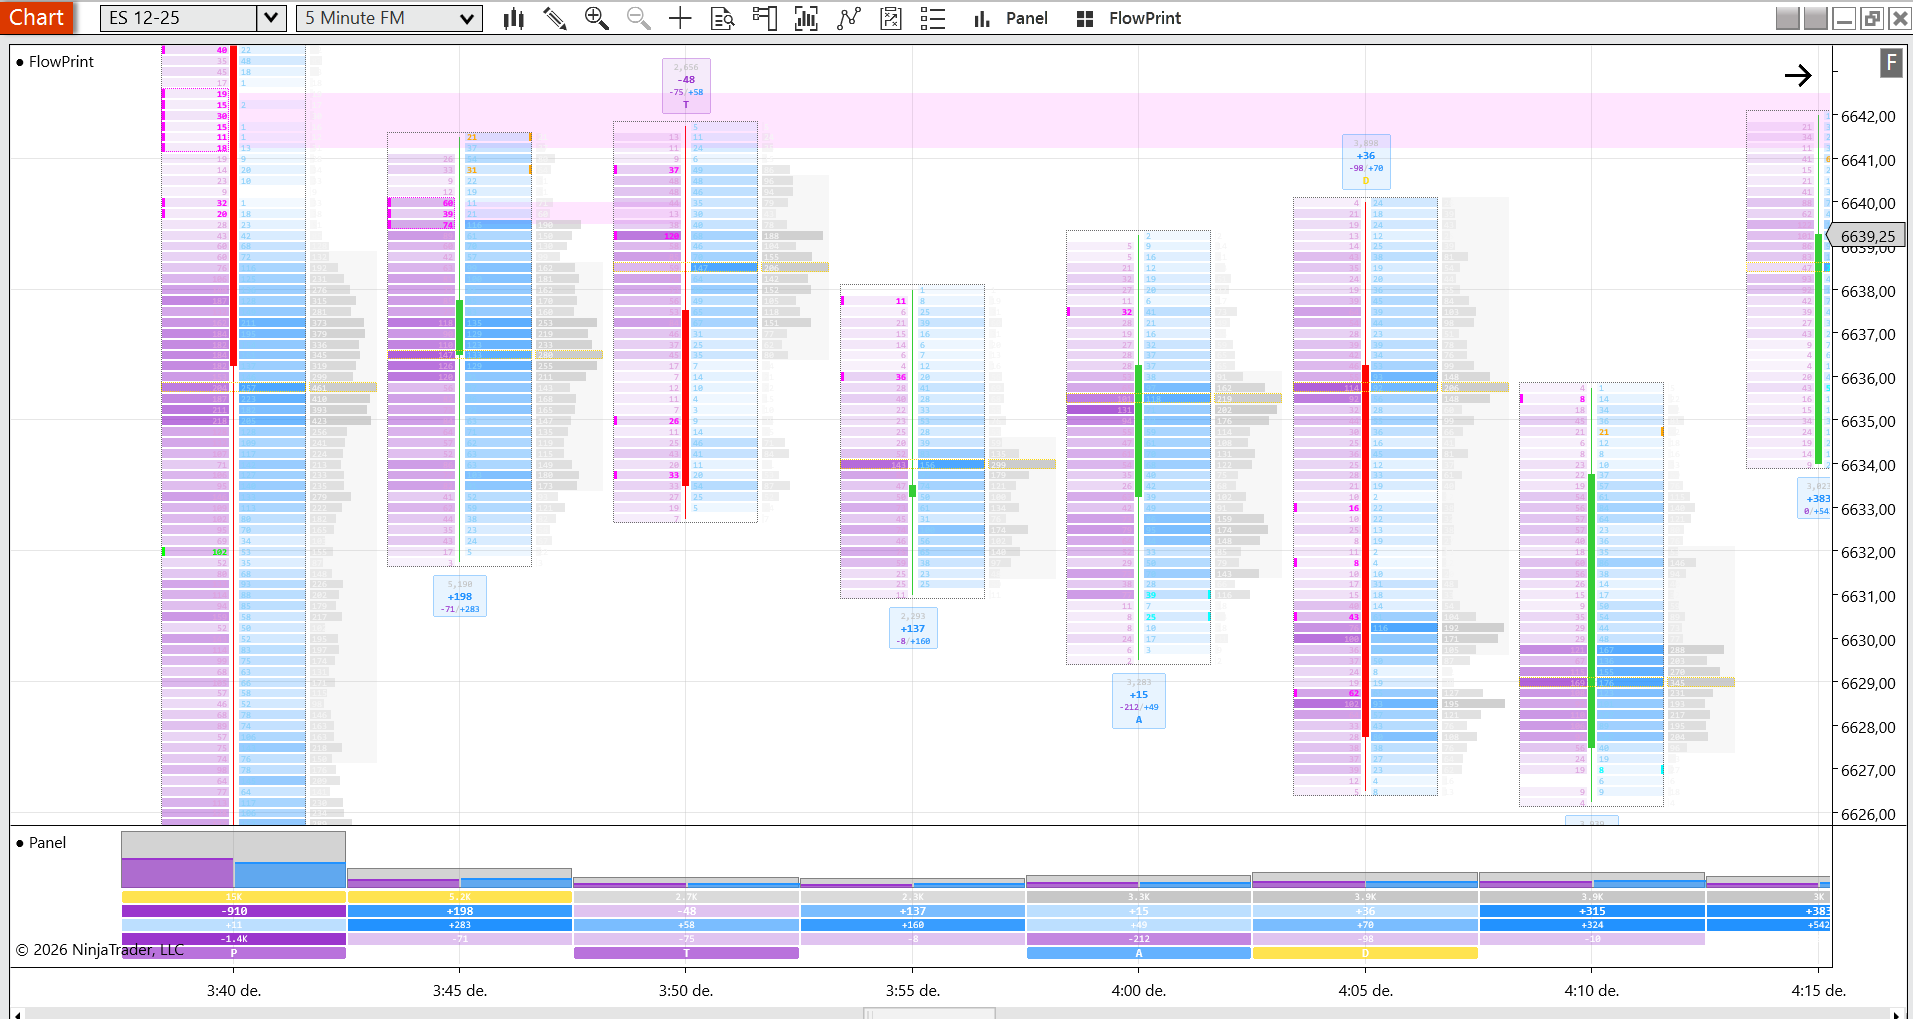
See Inside the Candles. Trade with Absolute Clarity.
Stop relying on lagging indicators and start reading the tape like a professional. The Ultimate Footprint Charting Suite is an elite charting add-on designed to visualize aggressive market participation in real time. By classifying every single tick on the fly, this suite provides a transparent view of the order book, showing you exactly where buyers and sellers are colliding.
⚡ The “No Tick Replay” Advantage
Most footprint tools slow down your platform by forcing you to enable heavy “Tick Replay” settings and re-download historical data. We eliminated that. Our proprietary engine classifies and aggregates every tick in real-time using dynamic quote rules (bids/asks) with a tick-rule fallback. Whether you are trading live or reviewing historical data, the footprint appears instantly on your active bar and every bar behind it—no extra loading, no hidden catches.
🎨 A Complete 6-Layer Visual Canvas
Customize your chart to match your exact trading style. Combine up to six independent rendering layers:
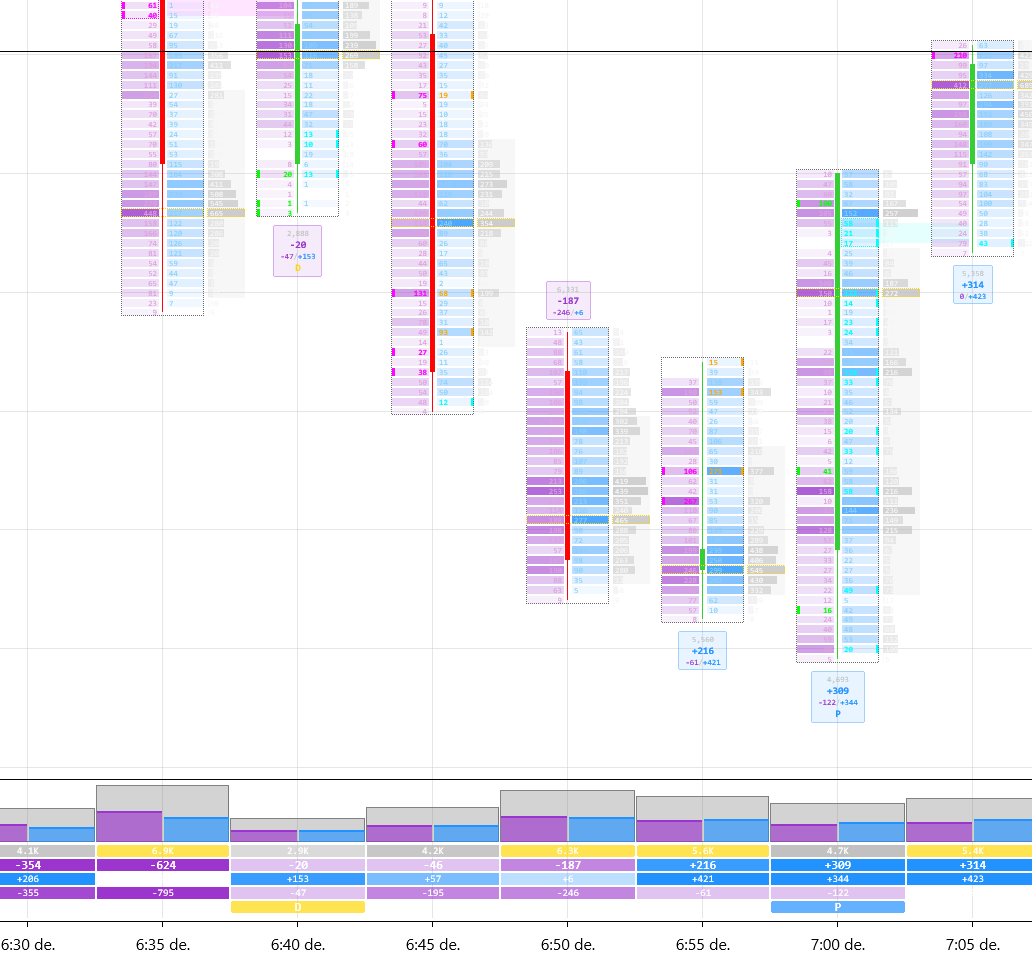
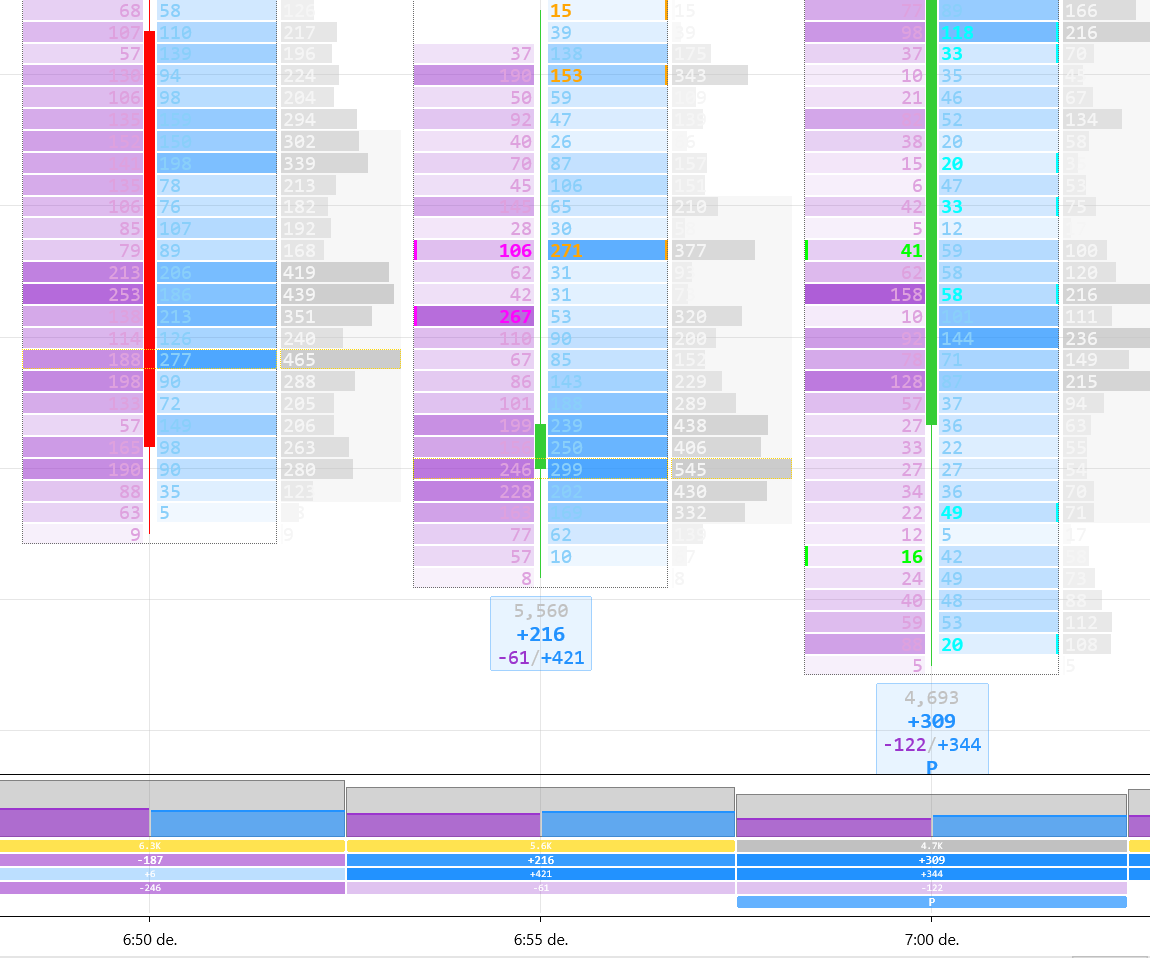
Footprint Cell Grid: View buy/sell splits per price row with volume heatmap coloring and optional cell bars.
Profile Bar: Choose from six distinct modes (Total, Split, Delta, Stacked, StackedPercent, ValueArea) displayed on the left or right, with inline delta text.
Mini Candle: Keep track of standard OHLC price action directly inside the footprint.
Delta Footer: Quickly gauge color-coded buy, sell, and net delta underneath every bar.
Stat Bar: A fixed, bottom-of-chart dashboard tracking Total Volume, Buys, Sells, Delta, and Delta Percentage—perfectly legible at any zoom level.
Interactive Hover Popup: Scroll and inspect deep data using the ‘Dense’ ladder view or the ‘Cockpit’ donut and delta gauge.
🕯️ Next-Generation Volume Candles
We didn’t just reskin default price candles; we built a new rendering engine from the ground up. Candle bodies are reconstructed entirely from the footprint’s buy and sell volumes, split horizontally or vertically, and driven by five unique proportion curves:
Raw
Amplified
Delta-based
Winner Takes All
Exponential
Bonus: Color saturation reflects volume dominance, and an optional per-bar Point of Control (POC) marker highlights the densest trading node.
🎯 Institutional Order Flow & Absorption Studies
Spot trapped traders and exhaustion instantly with built-in advanced order flow studies:
Imbalance Tracking: Detect diagonal imbalances where bid/ask ratios cross your custom thresholds, and flag “Stacked Imbalances” for stronger reversal/continuation signals.
Absorption Zones: Identify aggressive volume that failed to move the price. Clusters of absorption are mapped into continuous zones until broken by your chosen parameter (Touch, Traversal, or Close).
Advanced Markers: Map Naked POCs (untested past control points), Unfinished Auctions (extreme rows with both buys and sells), Exhaustion/Single Prints, and 5 distinct shapes for Delta Divergence.
⚙️ Plug-and-Play Templates & Session Anchors
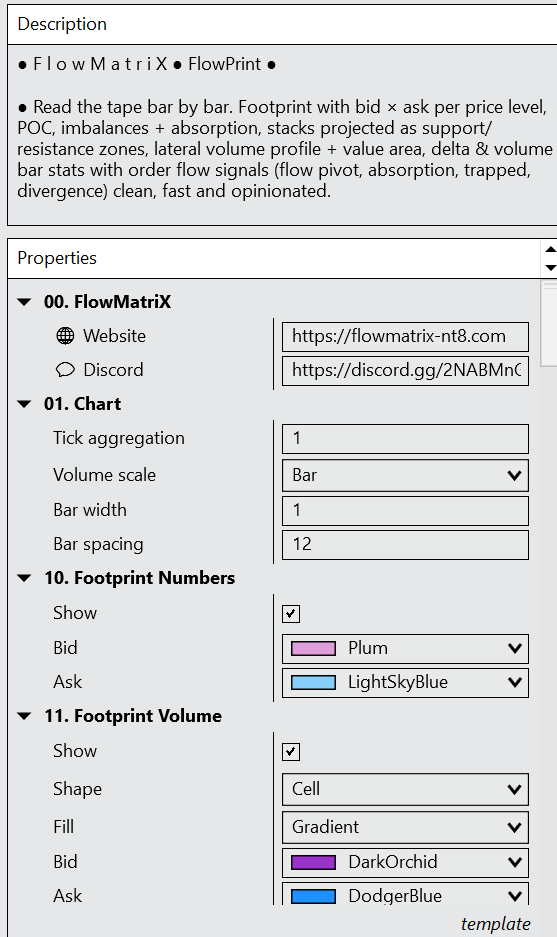
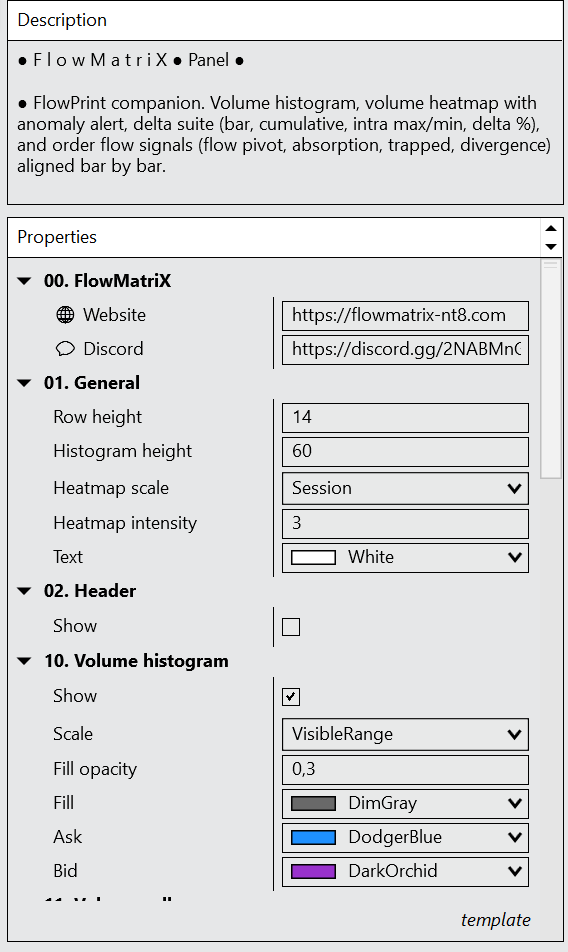
Don’t want to tweak a hundred settings? The suite comes packed with six professionally tuned templates: Default, Orderflow Trader, Clean, Heavy Stats, Scalper, and Swing. Choose your baseline, tweak it to your liking, and save it as a portable XML file.
The suite also automatically anchors crucial daily levels to your current session, including Initial Balance (High, Low, Mid), Session POC, and a fully tunable Session VWAP with dual standard deviation bands.
Key Features & Specifications
Platform Compatibility: Works seamlessly with major professional trading platforms that support custom volume/range/tick bar aggregations.
Tick Engine: Real-time quote/tick rule classification (No historical tick-replay required).
Data Requirement: Requires a real-time data feed with bid/ask volume access.
Export/Import: Easily share custom templates (.xml format) with your trading community.
Bar Types Included: Ships with integrated Minute, Tick, Range, and Volume bar types to power the underlying order-flow aggregator.


Reviews
There are no reviews yet.