Skip to content
OrderFlow Hub
  • Home
  • Shop
    • Premium Membership
    • Indicators
  • Analysis blog
    • Footprint and Order Flow
      • 03:00 AM
      • 10:00 AM
    • Traditional Analysis Methods
  • Home
  • Shop
    • Premium Membership
    • Indicators
  • Analysis blog
    • Footprint and Order Flow
      • 03:00 AM
      • 10:00 AM
    • Traditional Analysis Methods
×
0
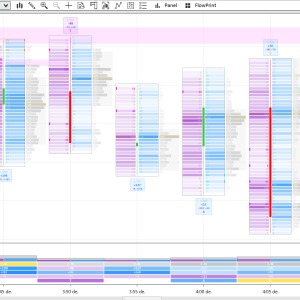
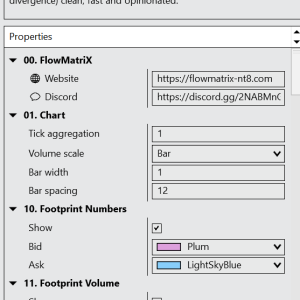
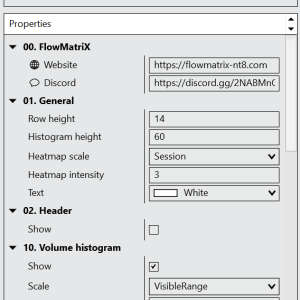
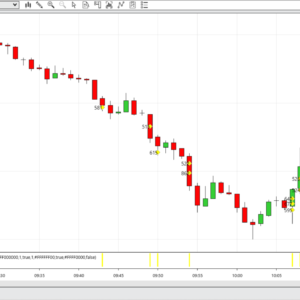
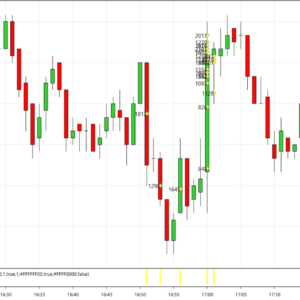
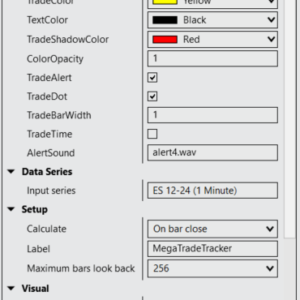
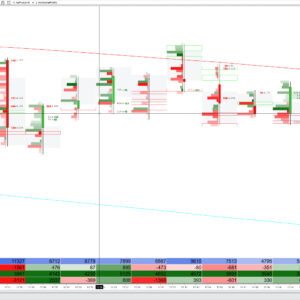
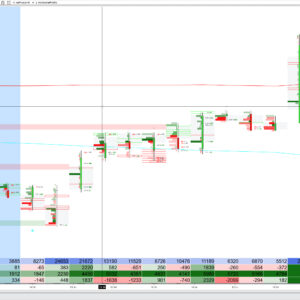
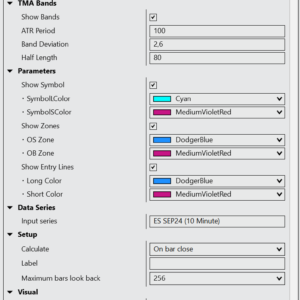
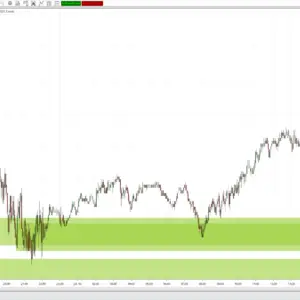
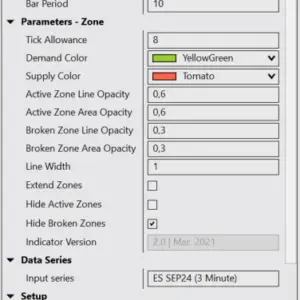
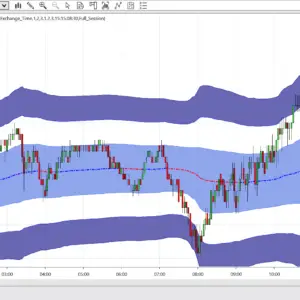
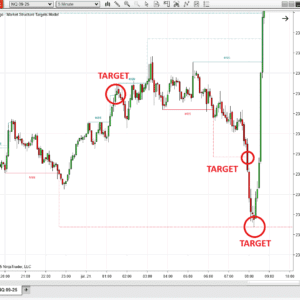
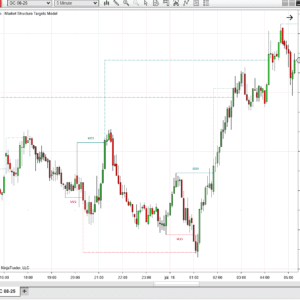
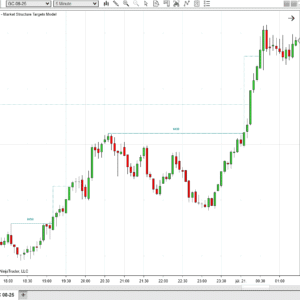
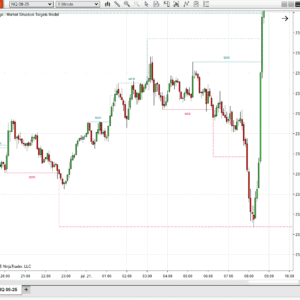
    NT8 INDICATORS

    Showing 10–18 of 43 results

    • NinjaTrader 8 chart showing Fair Value Gap boxes, premium and discount zones, and equal highs/lows highlighted by the Smart Money Concepts indicator.
      • NinjaTrader 8 chart showing Fair Value Gap boxes, premium and discount zones, and equal highs/lows highlighted by the Smart Money Concepts indicator.
      • NinjaTrader 8 chart displaying Smart Money Concepts indicator with labeled swing points (HH, HL, LH, LL), internal and swing break of structure (BOS) lines, and highlighted order blocks.
      • Smart Money Concepts indicator advanced settings showing configuration for Fair Value Gap detection, premium/discount zones, and bar confirmation parameters.
      • Smart Money Concepts indicator advanced settings showing configuration for Fair Value Gap detection, premium/discount zones, and bar confirmation parameters.
      • Smart Money Concepts indicator settings panel in NinjaTrader 8 with options for mode selection, styling, and internal and swing structure display controls.
      Add to cart

      Smart Money Concepts

      $ 100 Indicator
    • Sale!
      FM Footprint Charting Suite | Order Flow & Volume Indicator
      Add to cart

      FM Footprint Charting Suite | Order Flow & Volume Indicator

      $ 100 Original price was: $ 100.$ 80Current price is: $ 80. Indicator, OrderFlow
    • Sale!
      Trendline breakout example with real-time signals on NinjaTrader 8
      • Trendline breakout example with real-time signals on NinjaTrader 8
      • Trendlines with Breaks indicator settings panel in NinjaTrader 8
      Add to cart

      Trendlines with Breaks

      $ 130 Original price was: $ 130.$ 80Current price is: $ 80. Indicator
    • Sale!
      MegaTradeTracker indicator on NinjaTrader featuring trade volume spikes and time tracking for scalpers and swing traders
      • MegaTradeTracker indicator on NinjaTrader featuring trade volume spikes and time tracking for scalpers and swing traders
      • Multi-timeframe MegaTradeTracker view displaying real-time major trade volumes with customizable opacity and bar width settings.
      • MegaTradeTracker chart showing large volume trades highlighted with diamond markers and color-coded overlays for clear market activity visualization
      • MegaTradeTracker settings panel showcasing customizable volume thresholds, alert options, color schemes, and display preferences
      Add to cart

      MegaTradeTracker

      $ 150 Original price was: $ 150.$ 80Current price is: $ 80. Indicator
    • NinjaTrader 8 chart displaying SMT Divergences indicator with swing points and highlighted divergence signals between the chart symbol and external tickers ES and YM.
      • NinjaTrader 8 chart displaying SMT Divergences indicator with swing points and highlighted divergence signals between the chart symbol and external tickers ES and YM.
      • SMT Divergences indicator settings panel in NinjaTrader 8 showing options for enabling external ticker comparison, setting swing lookback period, and dashboard customization.
      • Close-up of SMT Divergences indicator on NinjaTrader 8 showing divergence markers and swing point comparisons between chart symbol and two external ticker
      Add to cart

      SMT Divergences

      $ 80 Indicator
    • Overbought/Oversold Signal
      Add to cart
      Rated 4.00 out of 5

      Overbought/Oversold Signal

      $ 80 Indicator, Oscillator
    • NinjaTrader 15-minute chart showing a highlighted green Demand Zone followed by a strong upward price reaction, indicating a potential trend reversal.
      • NinjaTrader 15-minute chart showing a highlighted green Demand Zone followed by a strong upward price reaction, indicating a potential trend reversal.
      • NinjaTrader 1-hour chart illustrating multiple red Supply Zones during a downtrend, highlighting key resistance levels where selling pressure increases.
      • Real-time visualization of supply and demand zones on a volatile chart, helping traders time entries and exits precisely.
      Add to cart

      Supply and Demand Zones

      $ 59 Indicator
    • Current Day VWAP Indicator
      Add to cart

      Current Day VWAP Indicator

      $ 59 Indicator
    • Market structure targets plotted across multiple timeframes to capture broader trends.
      • Market structure targets plotted across multiple timeframes to capture broader trends.
      • Market Structure Targets Model indicator settings panel in NinjaTrader with customizable options.
      • Horizontal target lines acting as support and resistance zones based on MSS and MSB.
      • Bullish Market Structure Break (MSB) breakout and upward target projection on NinjaTrader.
      • Bearish Market Structure Shift target reached on NinjaTrader chart with clear trend reversal.
      Add to cart

      Market Structure Targets Model – SMC Based Targeting NT8

      $ 45 Indicator, Market Structure
    • ←
    • 1
    • 2
    • 3
    • 4
    • 5
    • →
    Automated Strategy
    Free NT8 Products
    OrderFlow Hub logo – advanced order flow trading and market analysis software for NinjaTrader users

    Disclaimer

    The content, tools, and services provided on this website are for informational and educational purposes only and should not be considered as professional, legal, financial, or investment advice. We do not guarantee the accuracy, completeness, or reliability of any information or services offered, and all use of such content is at your own risk.

    By accessing or using this website, you acknowledge and accept the following:

    We do not provide any warranties, whether expressed or implied, regarding the suitability, reliability, or availability of the information, tools, or services provided.

    We are not responsible for any losses, damages, or liabilities resulting from your use of this website, products, or services. This includes, but is not limited to, financial losses, missed opportunities, or technical issues.

    Any decisions you make based on the information or tools provided on this website are solely your own responsibility.

    Risk Warning
    The use of any software, algorithms, tools, or strategies provided through this website may involve risks, including potential financial loss. You should not engage in any activity unless you fully understand the risks involved and have consulted with a qualified professional where appropriate. Only use funds or resources that you can afford to lose.

    No Liability
    Under no circumstances shall we, our affiliates, or our partners be liable for any indirect, incidental, special, consequential, or punitive damages arising from the use of this website or any associated products or services.

    By using this website, you agree to release us from any liability or responsibility for any claims, damages, or losses arising from your access to or use of this website and its contents.

    • Home
    • Shop
    • Analysis blog
    • Facebook page
    • Facebook group
    • Discord

    ©2024. All Rights Reserved