
The VPOC (Volume Point of Control) is a classic tool in any volume trader’s arsenal — but this version takes it beyond the standard.While traditional VPOC indicators rely on static formulas and fixed levels
Continue reading
The VPOC (Volume Point of Control) is a classic tool in any volume trader’s arsenal — but this version takes it beyond the standard.While traditional VPOC indicators rely on static formulas and fixed levels
Continue reading
MaxFO (Máximo de Fake) is a specialized indicator designed to detect fakeouts during the U.S. pre-market session, giving traders a structured way to anticipate false moves and time their entries on the first real impulse.
Continue reading
Esperanzag (pronounced: “Esperanza-graph”) is an advanced price leg dissection indicator that helps traders understand the true internal structure of market moves.
Continue reading
The Dynamic Support Resistance indicator is designed for traders who need their levels to move with the market, not lag behind it. Originally developed for algorithmic trading, this tool dynamically updates based on a custom formula that blends price and volume behavior.
Continue reading
Candle POC is a lightweight but powerful indicator that gives you a precise view into how volume is distributed inside each individual candle on your chart.By plotting the Point of Control (POC) for every candle as a clean yellow line
Continue reading
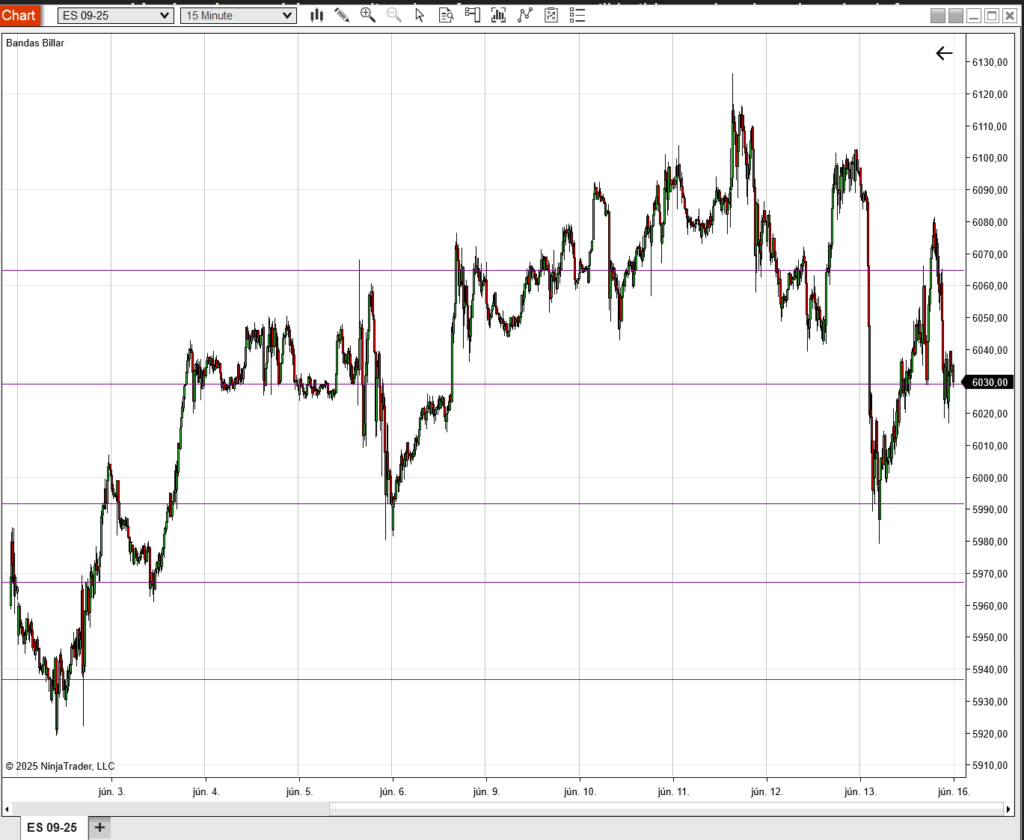
Billiard Bands is a unique indicator that blends price structure with artificial intelligence to replicate the way Basque trader Baiazuri draws key price levels manually — now automated, efficient, and real-time.
This tool isn’t about general support/resistance — it’s about precision. The indicator highlights the exact price levels where previous market reactions were strongest, helping traders anticipate turning points and act faster.
These levels are particularly useful for:
The algorithm is based on a studied replication of Baiazuri’s charting logic, where levels are drawn based on market memory, reaction points, and subtle inefficiencies.
Instead of drawing them manually session after session, Billiard Bands keeps your chart organized and informative without the guesswork.
You control how many levels are shown. Whether you’re working with a clean 1-minute chart or a Renko setup, the bands help define where the market is most likely to care about price — and when you should start paying attention.
Use it as part of the OrderFlow X – Algorithmic Master Pack, if you want to combine it with volume-based tools like ATA or Price Action Trail.

The Advanced Tick Analyzer (ATA) is one of the flagship tools in the OrderFlow X – Algorithmic Master Pack. It offers a unique perspective on market activity by combining real-time tape reading with volume heat zones, helping traders identify where institutional interest and strong hands are appearing — as it happens.
Continue reading