

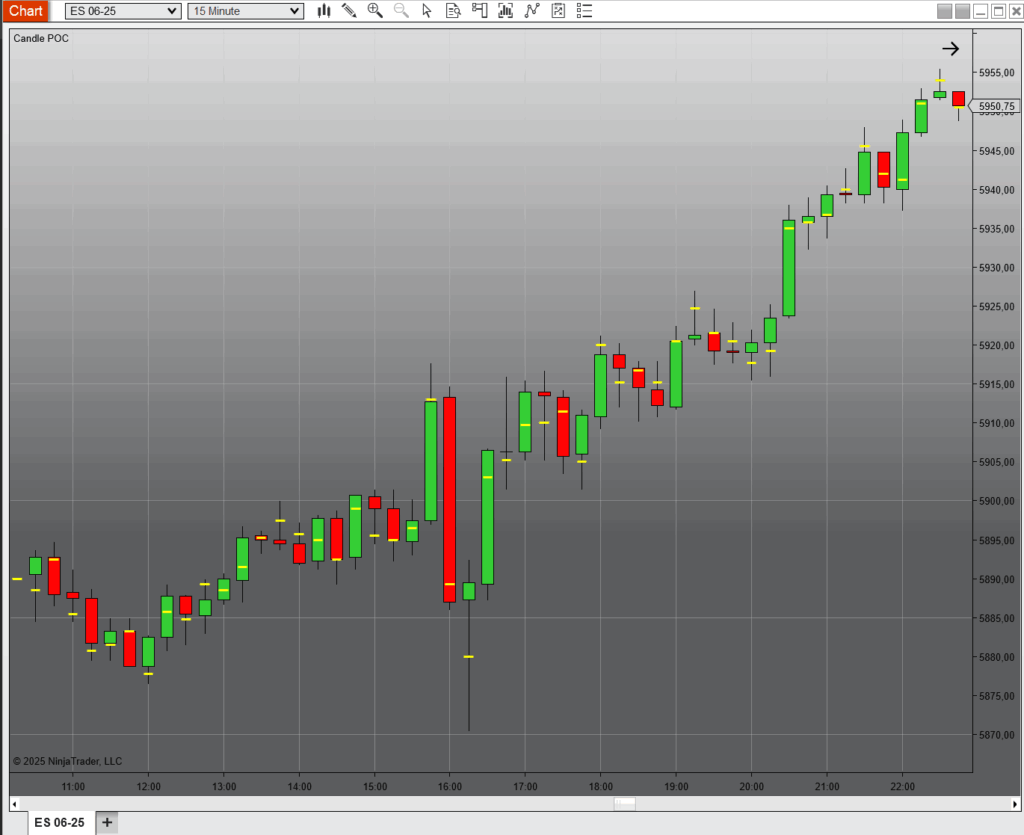
Candle POC is a lightweight but powerful indicator that gives you a precise view into how volume is distributed inside each individual candle on your chart. By plotting the Point of Control (POC) for every candle as a clean yellow line (customizable), it reveals the price level with the highest traded volume per bar — giving you instant insight into market intent on a micro level.
🎯 What Does It Do?
Instead of showing one large volume profile over a session or range, Candle POC breaks it down to the candle level.
It allows you to:
See where the majority of contracts traded inside each bar
Detect volume anomalies, absorption zones, and inefficiencies
Visualize micro price acceptance and rejection as they form
Each yellow line represents the POC of that specific candle, and can be used to understand how participants are behaving tick-by-tick.
🛠️ Use Cases
Works great for scalping, microstructure analysis, and volume-based setups
Helps identify whether price is accepted or rejected inside each bar
Combine it with other indicators (like Delta Divergence or ATA) for stronger setups
Ideal for high-frequency trading logic or custom builder setups
📌 Why It Matters
While most volume indicators give you big-picture insights, Candle POC gives you a microscope into how volume forms inside each bar — giving day traders and scalpers the edge they need in fast-moving markets.
No comment yet, add your voice below!