

OrderFlow Analysis of S&P 500 for June 28, 2024
Introduction
In this analysis, I aim to determine the opening of the S&P 500 on June 28, 2024, and the direction of the news at 10:00 AM.
Key Observations & Previous Day Analysis
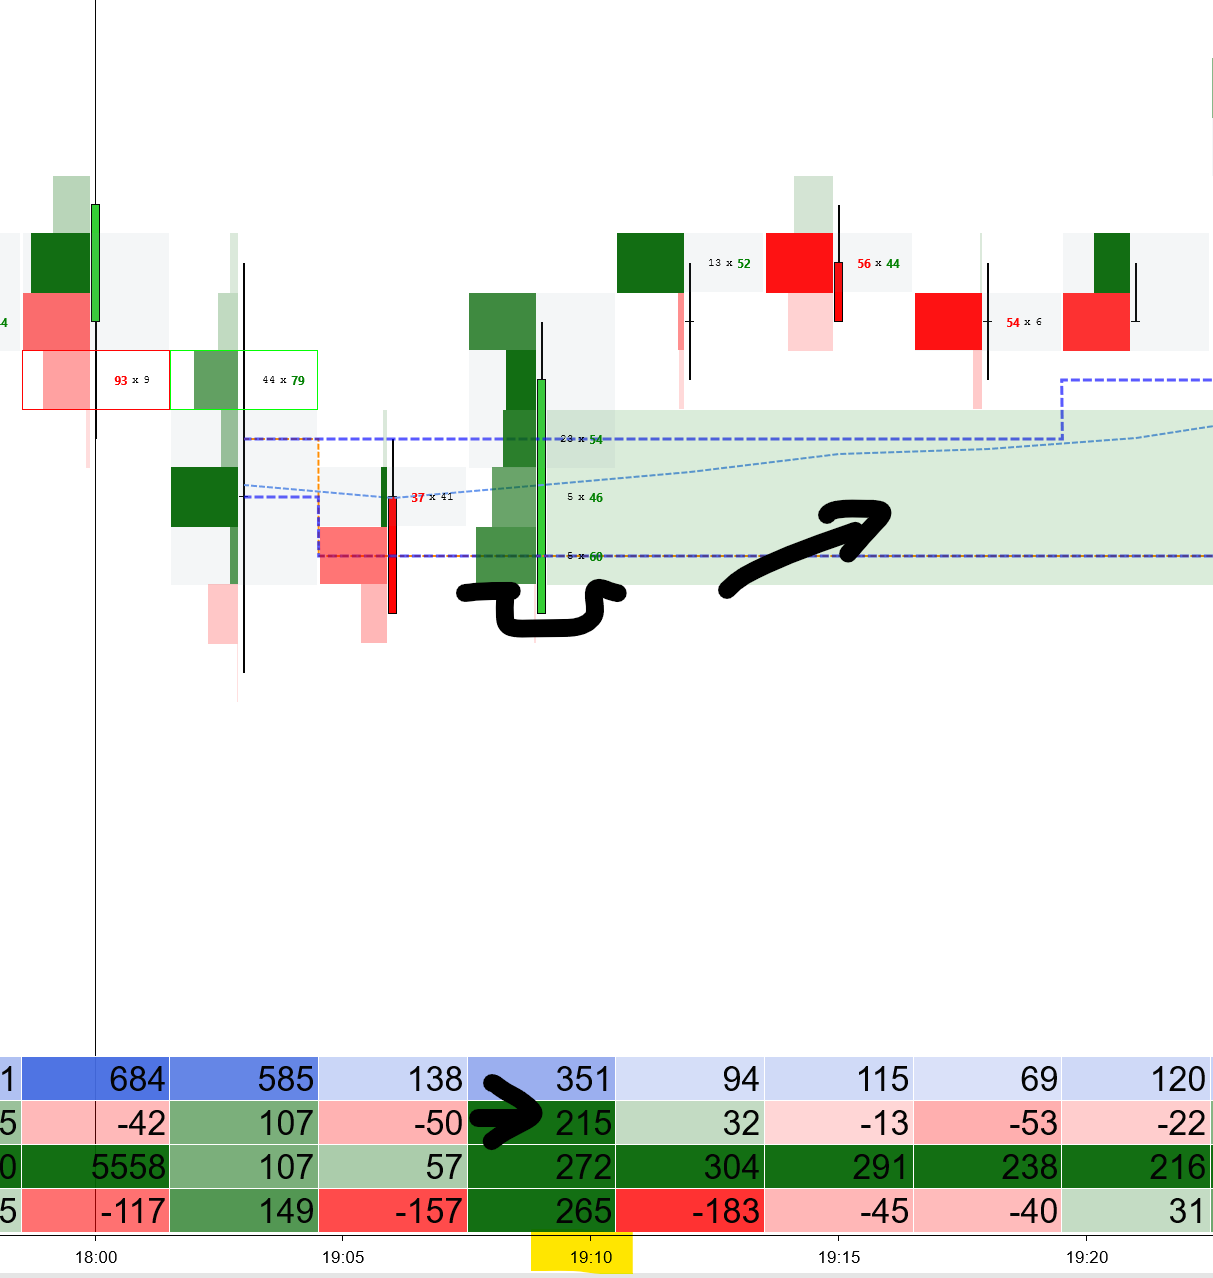
It is observed that on the previous day at 18:10 (shown as 19:10 on the chart due to a 1-hour delay in NinjaTrader relative to New York time, which I will adjust later), there was a strong positive delta shift at three price levels with a value of +215.
Pre-Market Session
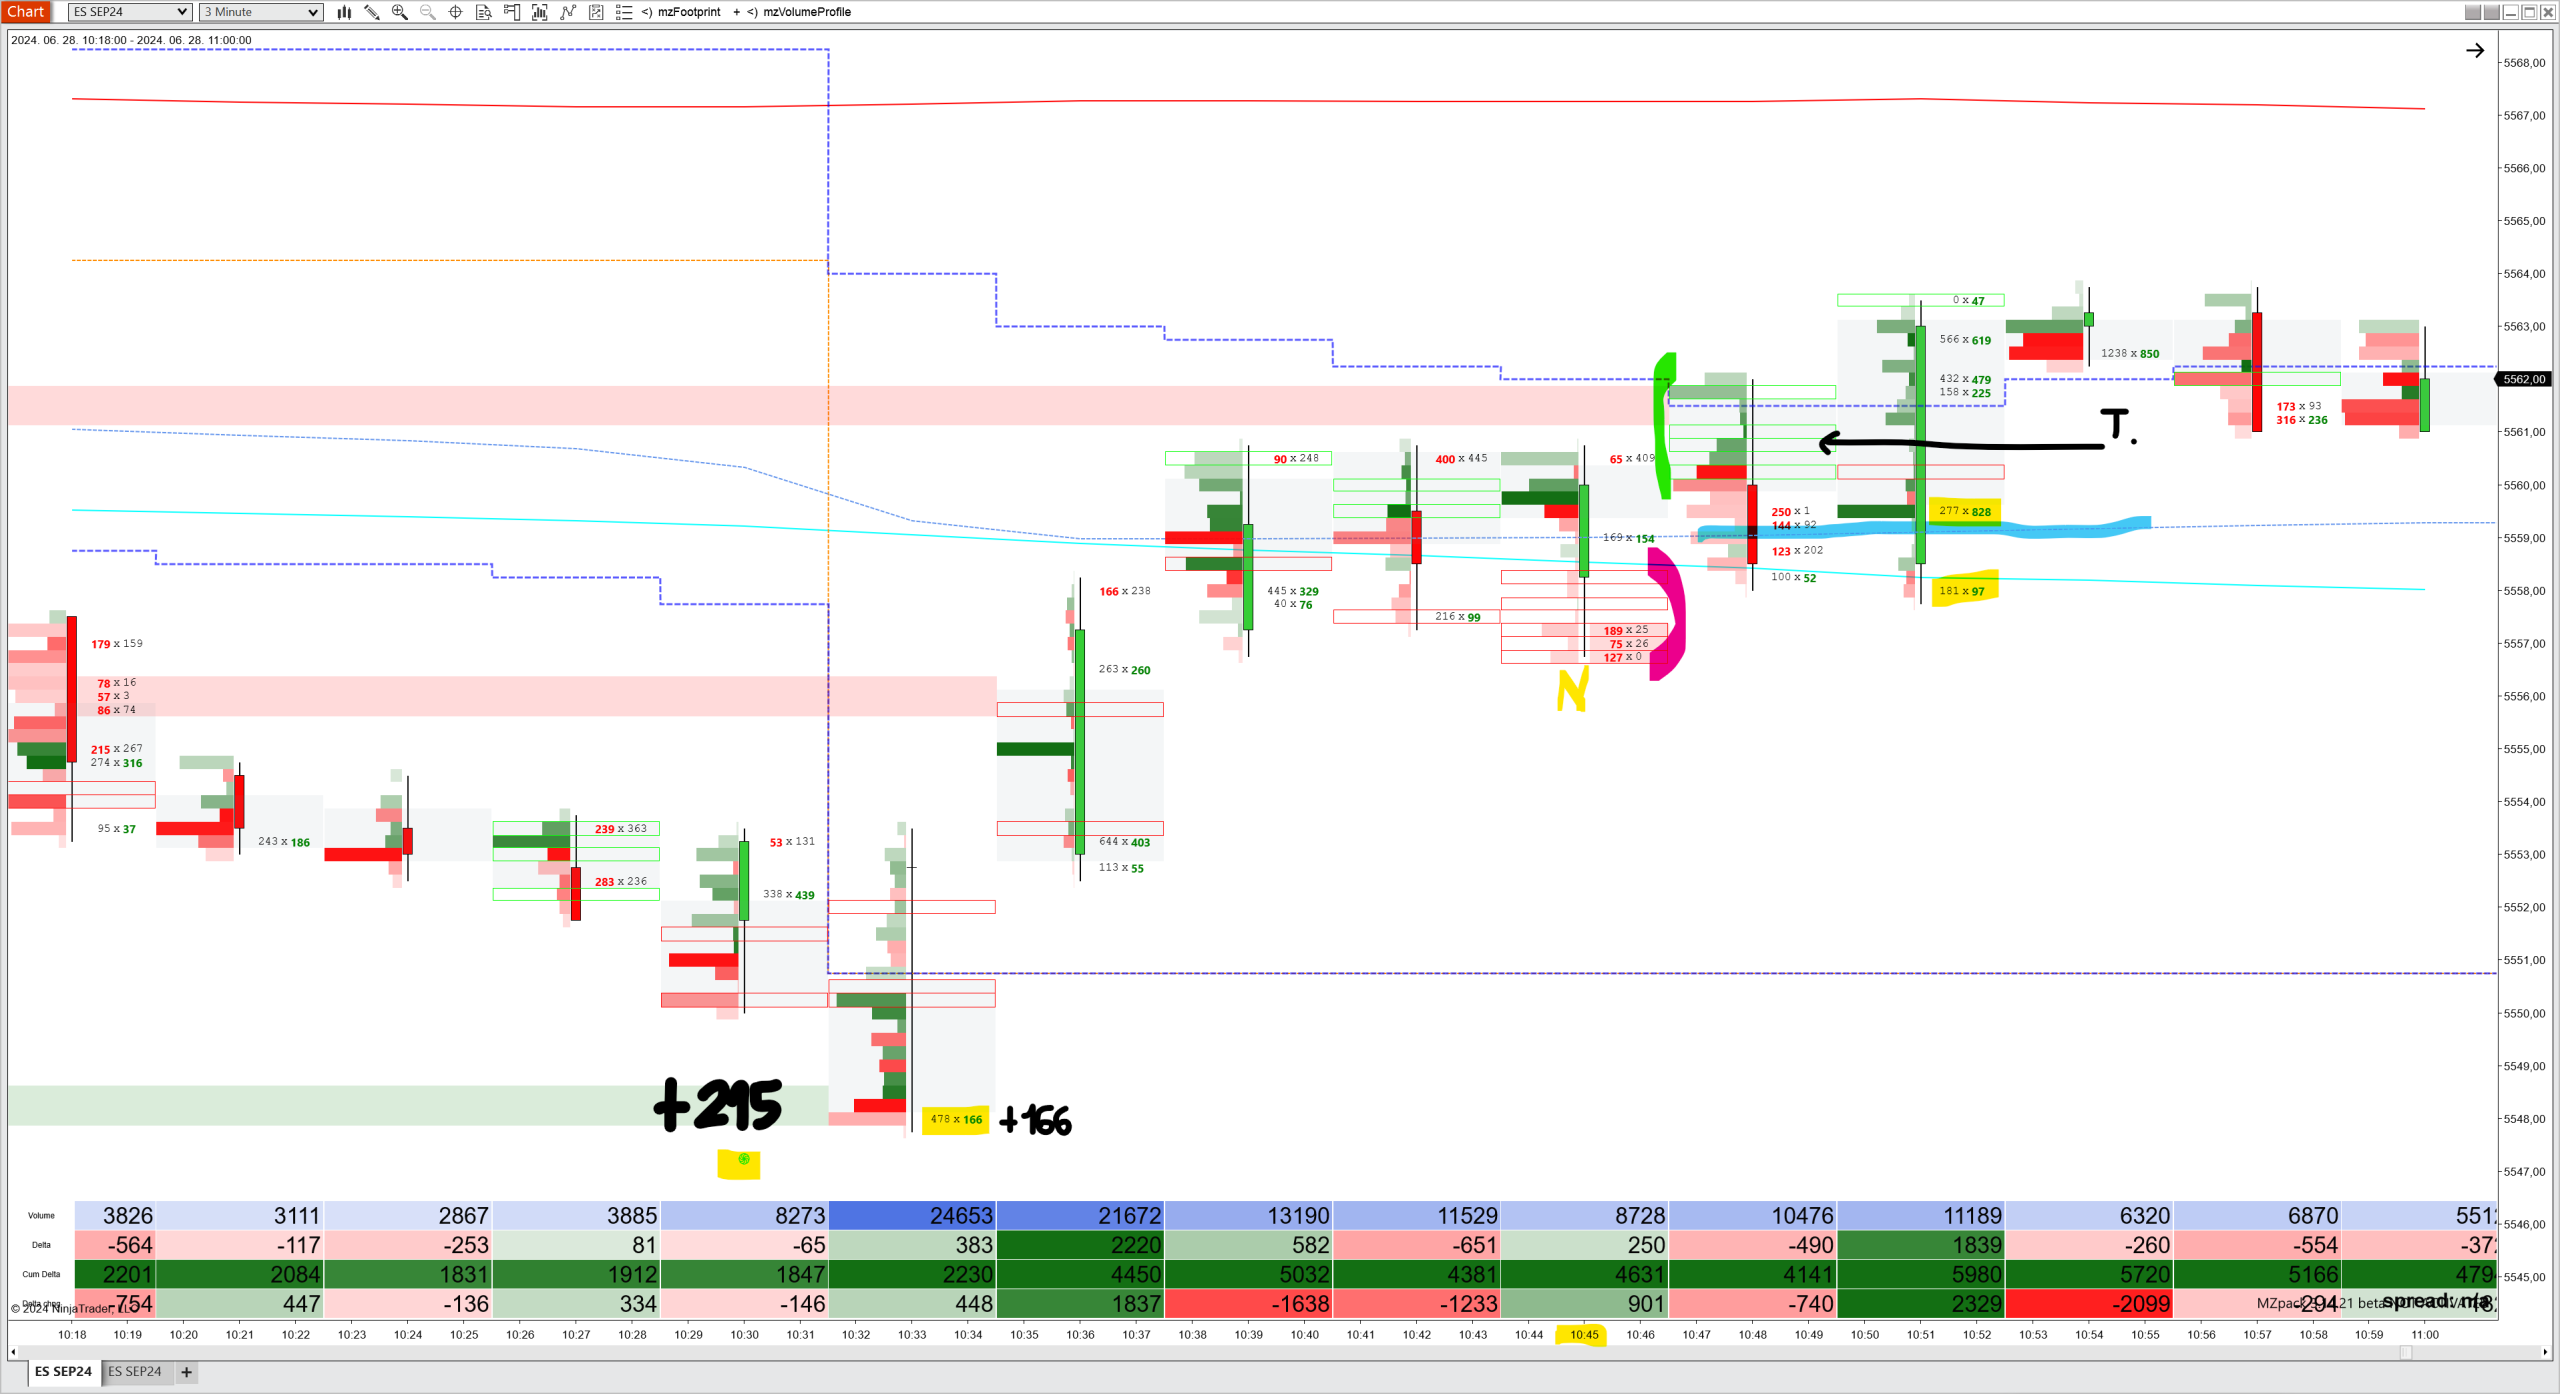
This is significant because as we approach 9:30, the start of the pre-market session, the price reaches the previous +215 delta level and responds again with strong buying at this price level, indicated by a +166 delta cluster:
Key Event at 9:45
The next news event is at 9:45. It is important to monitor the Footprint chart during this time. Two candles show strong absorption, highlighted in green and red on the chart.
Price Movement at 9:51
At 9:51, the price rises above this level. I marked with a black line the level to which the price may pull back. This level was chosen because it is visible that the delta histogram value increases significantly from that point, making it unlikely for the price to drop below it.
Delta Shifts
At the bottom of the 9:45 candle, there is still a strong positive delta level observed (highlighted in yellow on the chart), indicating significant strength as this delta shift occurred at the very bottom of the candle.
Conclusion
Based on this information, we can conclude that the 10:00 AM news will likely push the price further in a positive direction, making it advisable to open a long position.
Cumulative Delta Analysis
Additionally, observing the cumulative delta, it can be seen that between 9:00 and 9:30, it halved compared to the previous hours, yet still showed strong positive values. From 9:30 onwards, the cumulative delta increased again to around 4000, similar to its previous values.
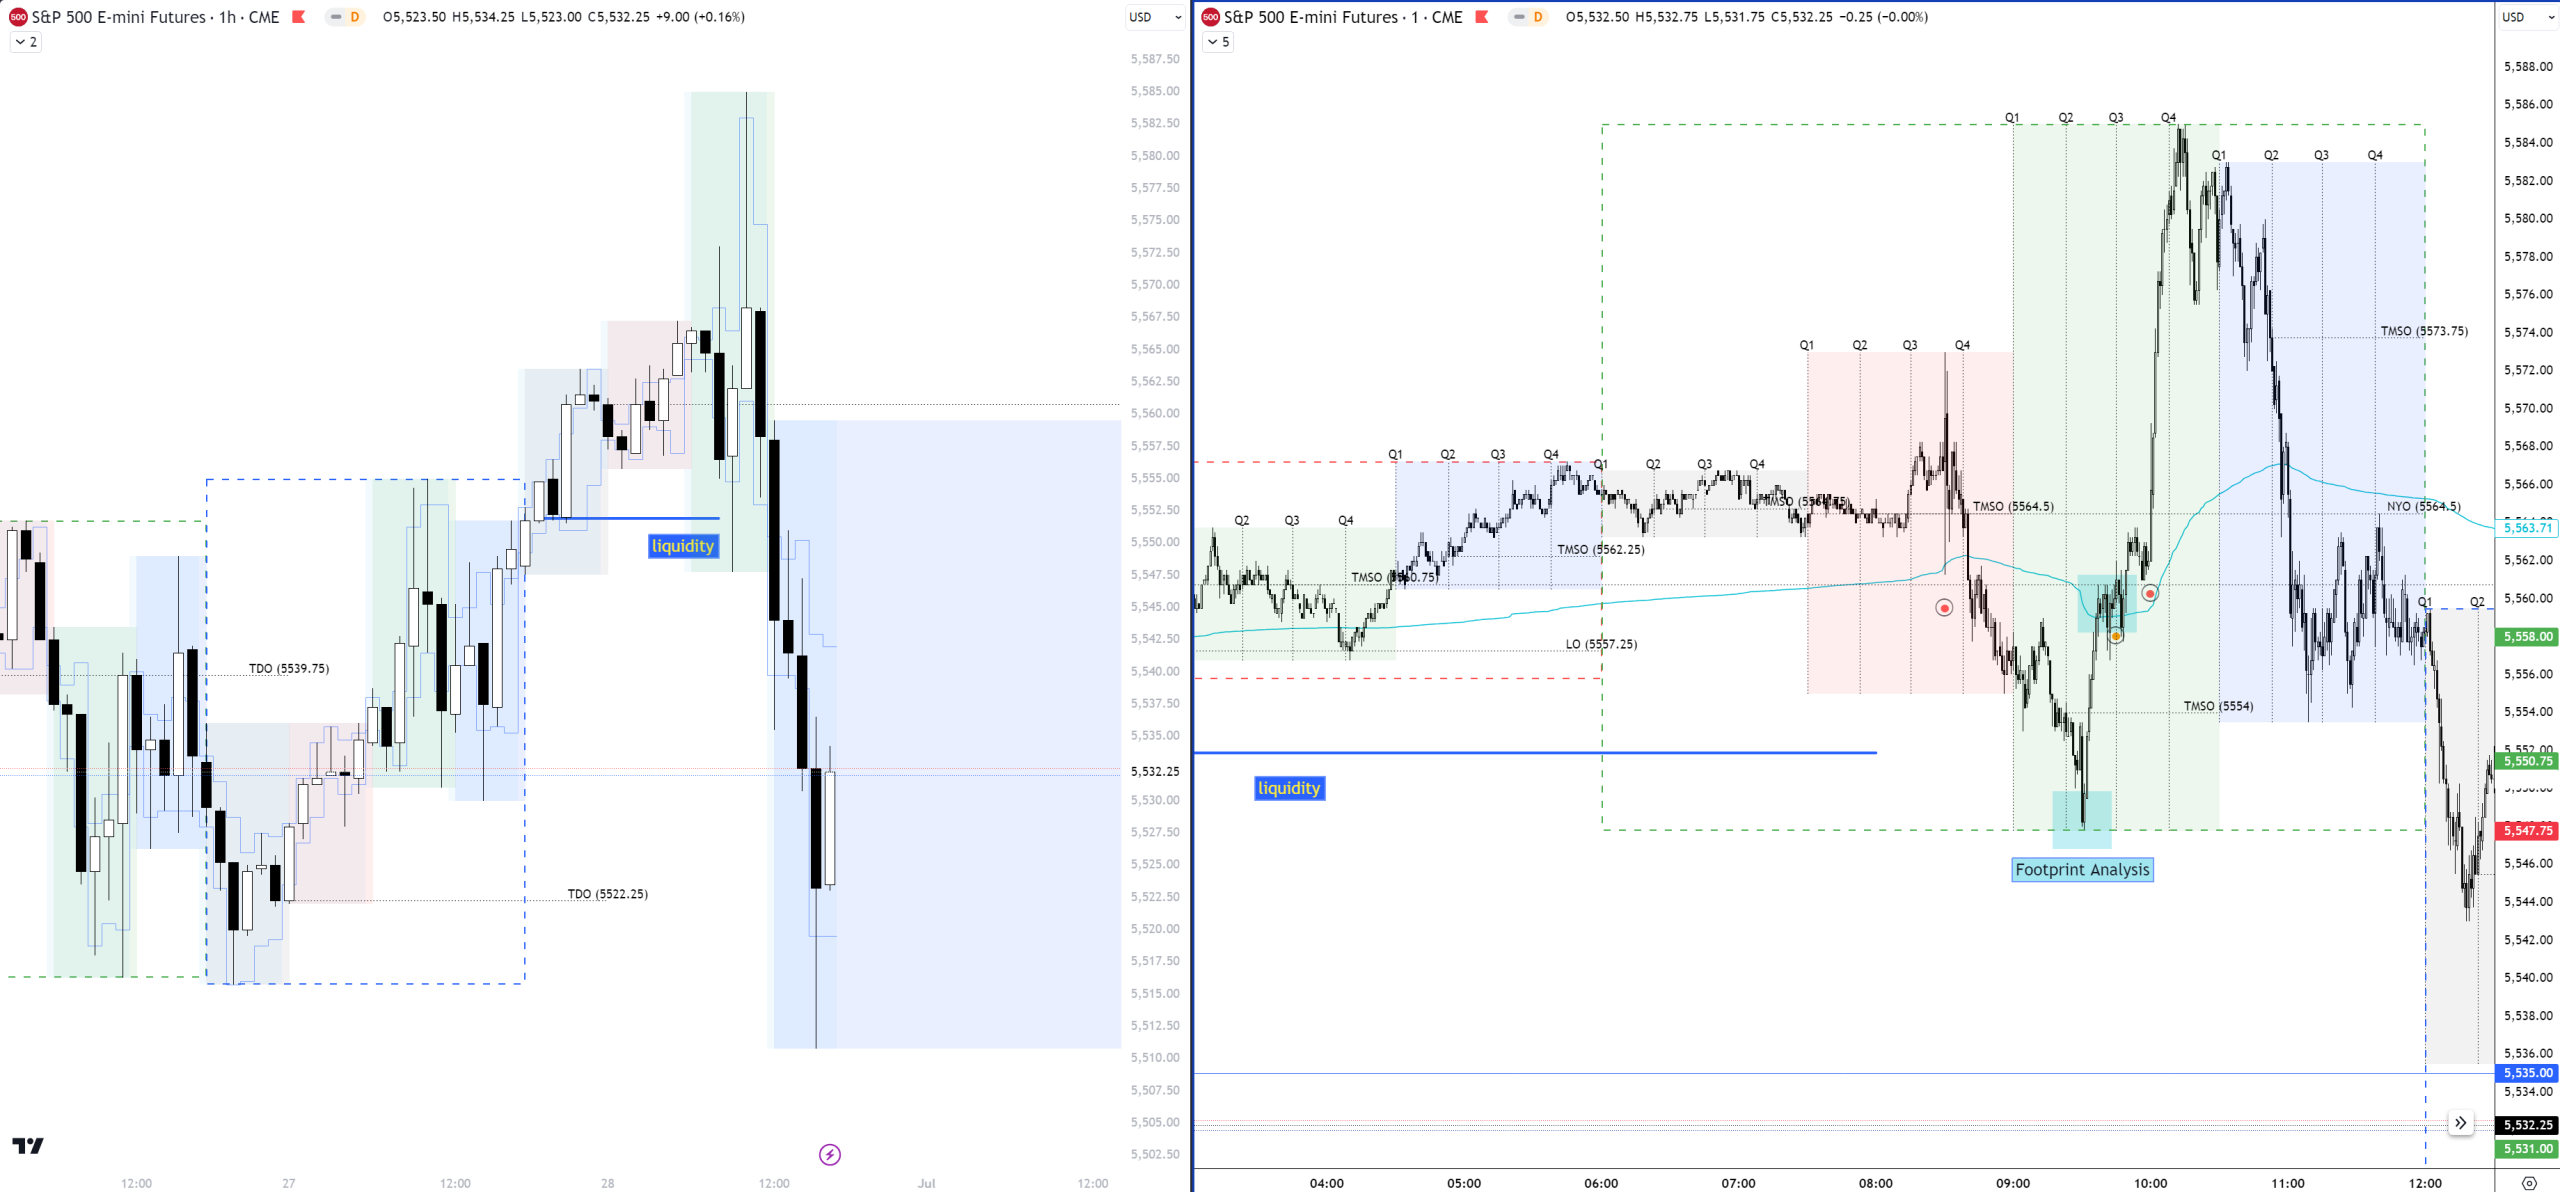
The Quarterly Theory helps identify liquidity. In the image below, you can see the chart according to the Quarterly Theory distribution, which also includes a VWAP line. The Quarterly Theory is an analytical method developed to examine market cycles and seasonal trends. This theory focuses on how the market changes during specific periods and helps identify key levels where liquidity and price movements are concentrated. Such analyses can be valuable for traders to better understand the underlying factors driving market dynamics and to make more informed decisions.


No comment yet, add your voice below!