

Trading Analysis for July 19:
Introduction
On July 19, 2024, as we approached 1:00 PM, a notable trading pattern emerged, illustrating the dynamics of aggressive buying and selling. In this analysis, we will examine the events around 1:00 PM and how they reflect on the S&P 500 using the Quarterly Theory, footprint charts, and Bookmap.
Quarterly Theory Analysis
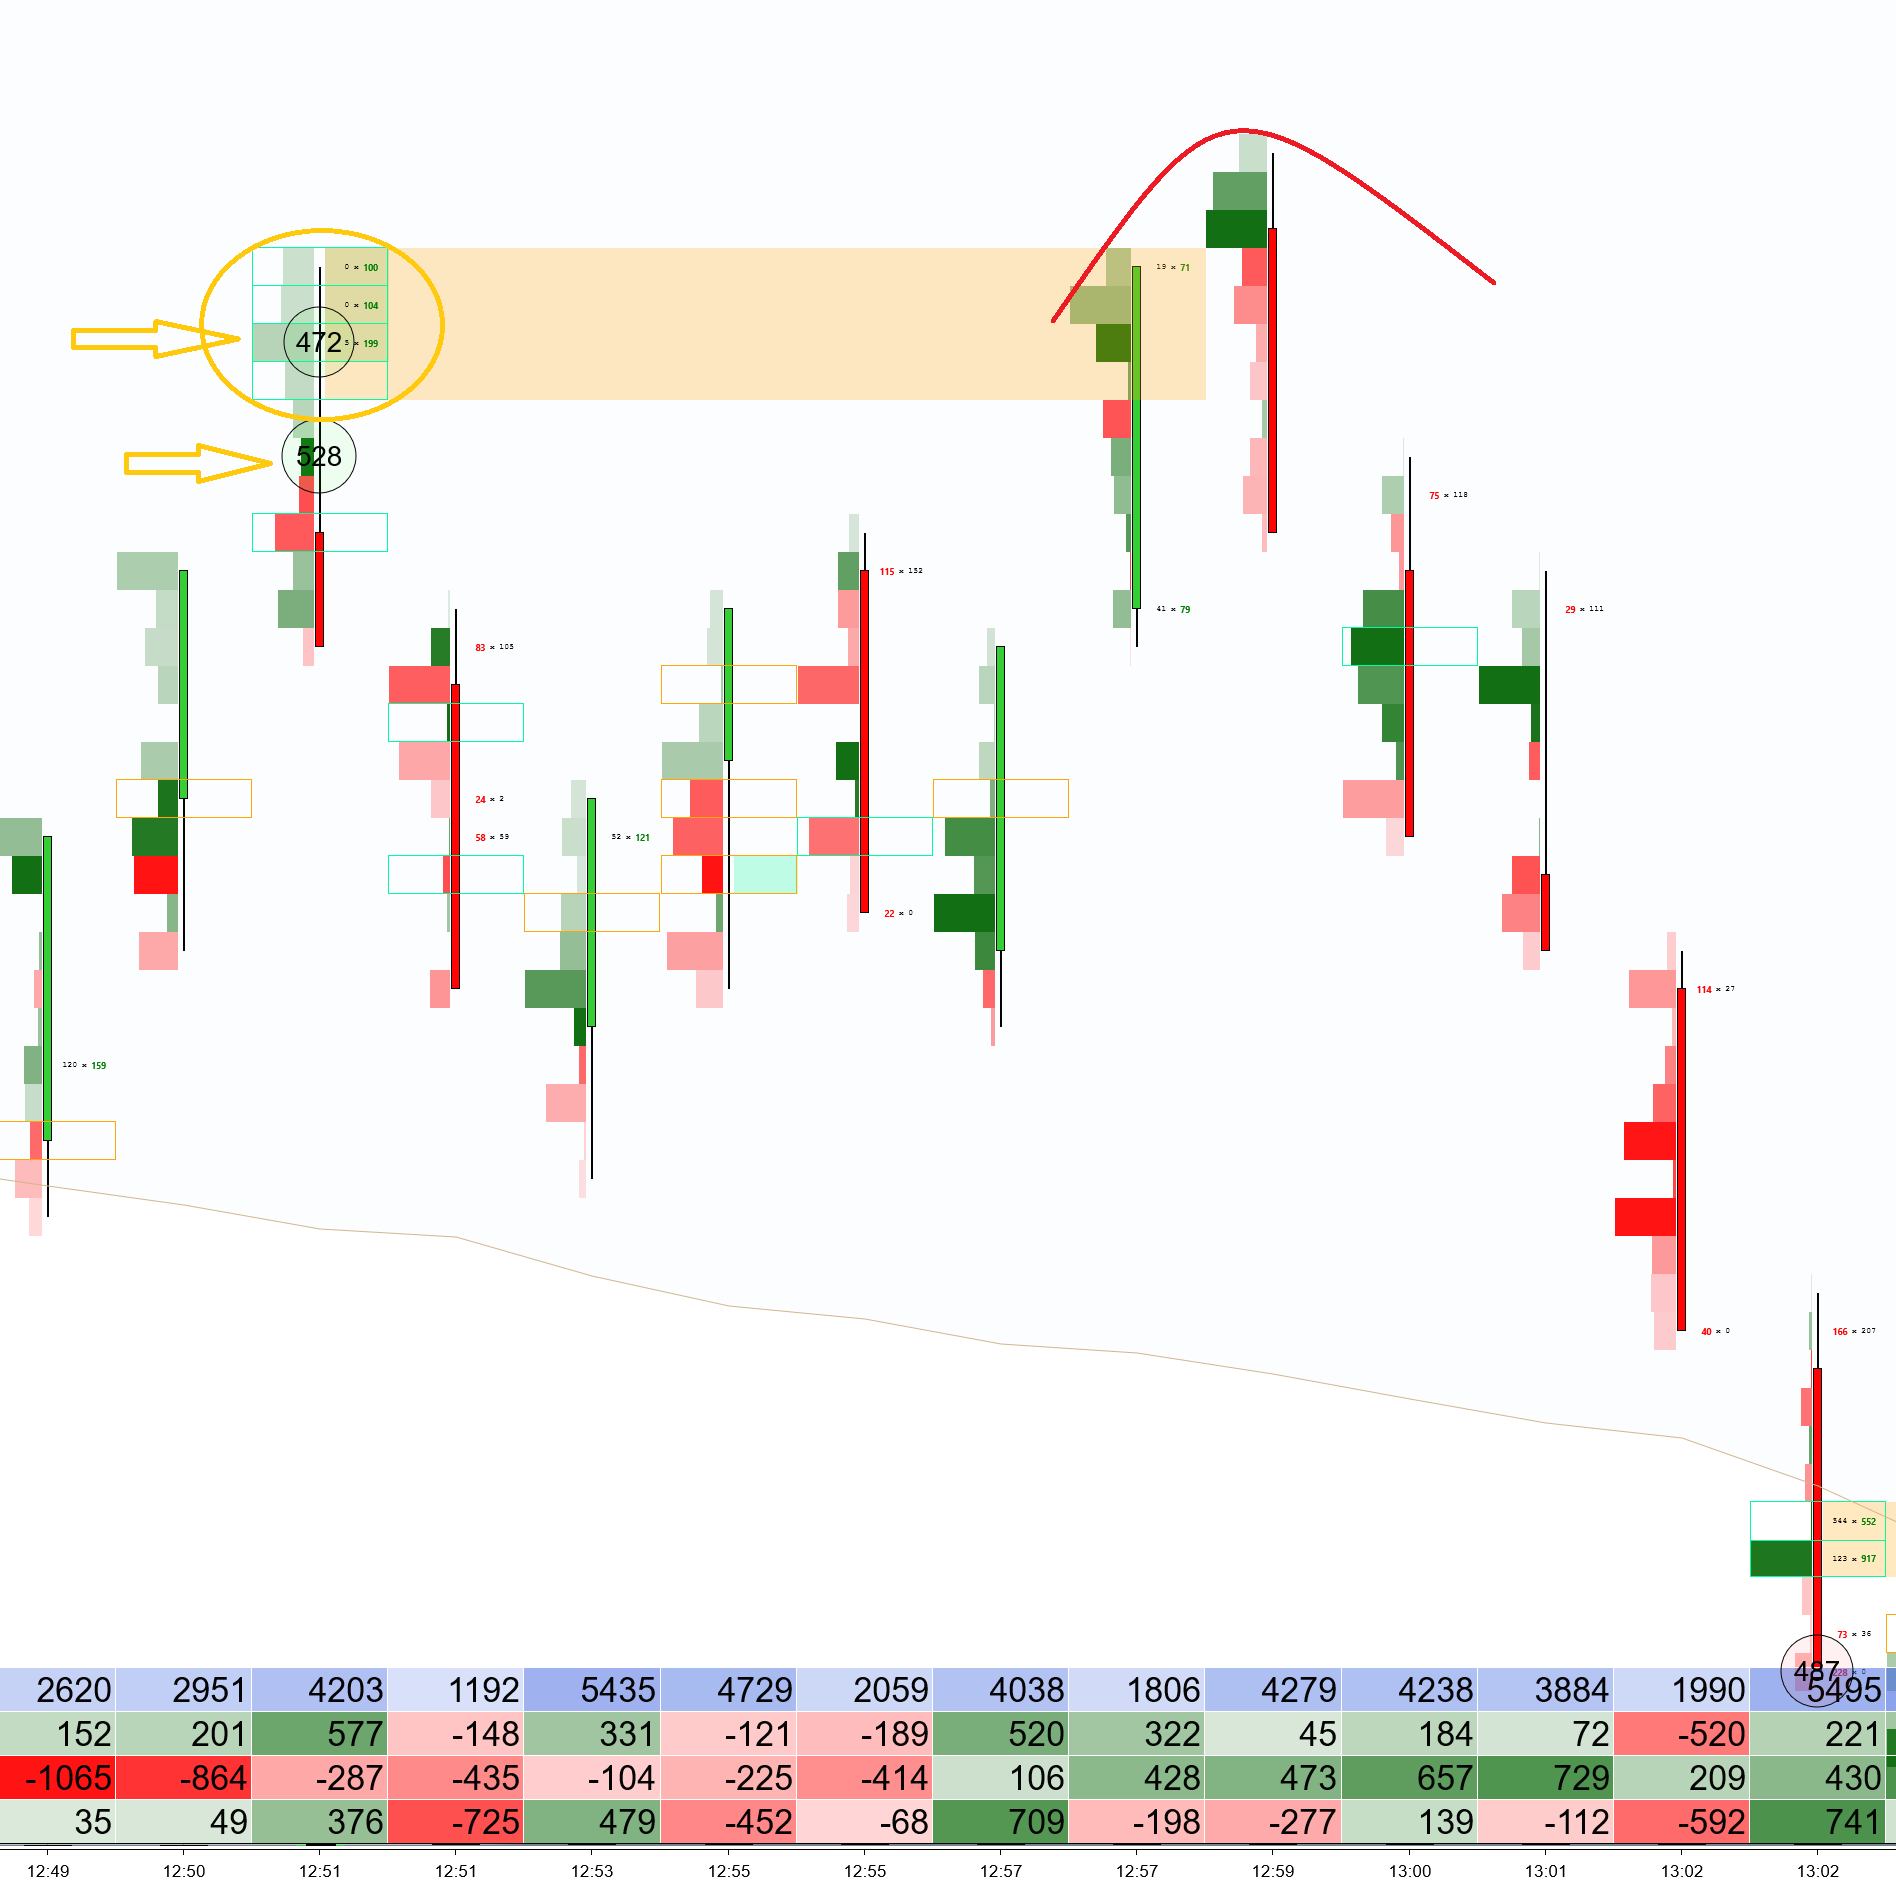
The TradingView Quarterly Theory 1-minute diagram highlights the key area of focus. This diagram effectively demonstrates a scenario where aggressive buyers reach a certain price level, only to be overtaken by aggressive sellers, leading to a reversal.

Observations
Footprint and Bookmap Charts:
- At 12:51 PM, a significant sweep is observed on both the footprint and Bookmap charts.
- As the price revisits this level around 12:59 PM, the Bookmap shows that limit sellers are entering the market.

Trading Strategy
Short Trade:
- If considering a short position, it is crucial to monitor specific indicators. The footprint chart highlights a distinctive candle pattern and delta histogram, indicating that sellers are losing strength. Additionally, the volume has decreased, signaling a potential weakening of the bearish momentum.
Key Indicators:
- Candle Pattern: The footprint chart reveals characteristic candle formations around the reversal point.
- Delta Histogram: The histogram shows a decline in selling pressure.
- Volume: A drop in volume confirms reduced bearish activity.
Conclusion
The analysis of July 19 provides valuable insights into market behavior around significant trading hours. By observing the aggressive buying and selling patterns and key indicators on the footprint and Bookmap charts, traders can make more informed decisions about entering or exiting positions.


No comment yet, add your voice below!