

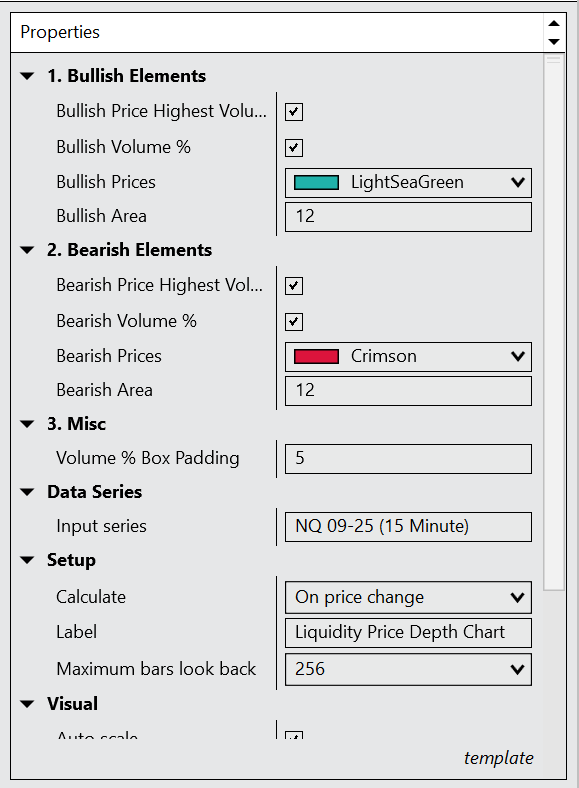


Key Features:
Dynamic Depth Visualization:
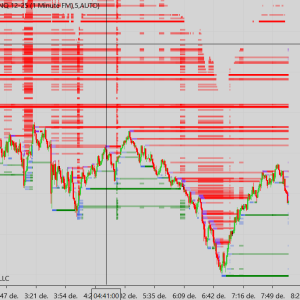
Instantly recalculates liquidity data as you pan or zoom your chart, keeping insights accurate to the current visible range.Bullish vs Bearish Price Mapping:
Displays bullish liquidity lines on the left and bearish ones on the right, each representing volume displacement at key price levels.Volume Displacement Insight:
Larger deviations from the x-axis indicate deeper liquidity pockets and greater volume concentration — perfect for spotting hidden support/resistance.Liquidity Clusters & Voids:
V-shaped patterns may evolve into box-like formations, suggesting liquidity accumulation or price congestion. Gaps or “voids” between points hint at areas with limited historical volume — often prime zones for future movement.Volume-Based Support & Resistance:
The indicator marks the highest-volume price points for both bulls and bears using dotted horizontal lines — great for anticipating reaction zones.Real-Time Sentiment Readout:
A percentage breakdown of bullish vs bearish volume sentiment is shown at the base of the chart — giving you an immediate view of directional dominance.
Ideal for:
Orderflow and volume profile traders
Institutional-style scalpers and swing traders
Traders looking to identify high-liquidity reversal points
Analyzing accumulation/distribution without needing a DOM


Reviews
There are no reviews yet.