


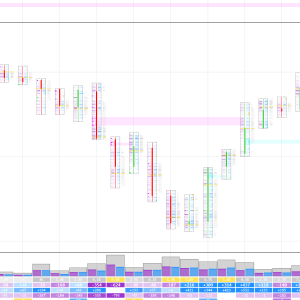
1. Heaviest Volume Highlights
The most critical part of any footprint chart is where the heaviest volumes were traded. TD Order Flow automatically highlights these areas, ensuring you can spot them instantly. These zones are crucial as they often represent strong support or resistance areas.
2. Unfinished Auctions
Every footprint reflects an auction process, which ideally ends with no trades at the High BID or Low ASK. However, when this process fails, it creates an “unfinished business” that acts as a magnet for the price. TD Order Flow identifies these failed auctions and draws lines on the chart until the price revisits these areas to “fix” them, turning failed auctions into successful ones.
3. Trades Filter for Institutional Orders
The Trades Filter enables you to eliminate smaller orders, focusing solely on the biggest institutional trades. By filtering out noise, you can easily spot major support and resistance zones created by large orders.
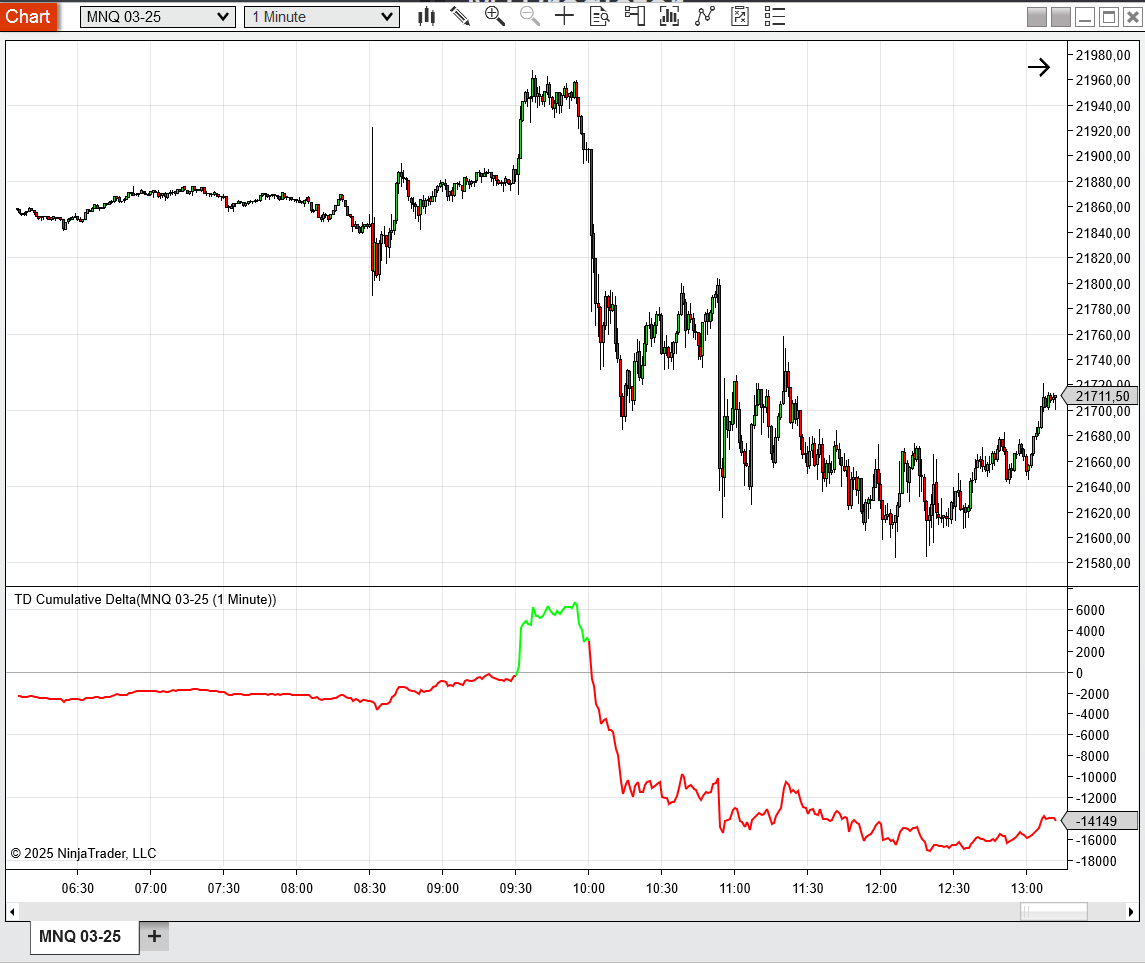
4. Cumulative Delta Analysis
Cumulative Delta is an essential tool for spotting divergences between price and delta.
Example:
- If the price is falling but Cumulative Delta is rising, it indicates strong buyers entering long positions despite the downward price movement.
- This divergence often signals an imminent trend reversal, making it a powerful standalone strategy or a complement to identifying support and resistance zones.
5. Built-In Volume Profile
TD Order Flow includes a built-in Volume Profile feature to give you a broader market perspective. By integrating this feature, you can analyze key price levels with higher accuracy and align your strategies with the bigger picture.
6. Customizable Visuals and Information Panels
TD Order Flow allows you to toggle various panels and adjust visual settings to fit your trading style. From summary panels providing critical data to the ability to personalize what you see on your charts, it’s designed to reduce clutter and enhance focus.


Reviews
There are no reviews yet.